---
AI Summary: "\\- Transitioned InVivo Analytics to our software development services,\
\ enhancing their preclinical imaging capabilities. \n- Developed 2D and 3D Region-Of-Interest\
\ editors, image viewers, custom report generation systems, and charting tools.\
\ \n- Utilized React for building the medical image user interface, delivering\
\ software ahead of schedule."
Anonymous: false
Assignee:
- J. David Giese
Last Edited Time: '2025-02-01T16:40:00+00:00'
case_study_510ks: []
client_logo:
- 18abd5b7-a754-80c5-93ff-c4a70d69f704
client_name: InVivo Analytics
date: '2015-07-31'
featured: false
medical_panel: ' Pre-Clinical'
name: Preclinical Imaging Analysis Platform
services:
- 9dc4f55a-b5cb-419f-8bae-5e11d6b11fee
summary: Accelerated software development compared to prior general-purpose software
team
tags:
- Web-App
testimonials:
- 7df2c557-d662-41de-834d-4f9029623798
---
## The Problem
InVivo Analytics is a small academic startup that was interested in our software development services because of our expertise in medical imaging. [InVivo Analytics](http://invivoax.com/) is developing hardware and software to enable fully automated analysis of preclinical imaging studies.
They were looking to build a new team for developing their software, since their existing software partner didn't have medical-imaging expertise and was making slow progress.
## The Outcome
We took over their existing product and delivered working software to their company in a shorter timeline than expected.
## The Solution
We helped InVivo Analytics extend the existing visualization, data analysis, and 3D image reconstruction features of their web application. We also designed and developed:
- 2D and 3D Region-Of-Interest (ROI) editors
- Image-viewers with adjustable windowing and leveling
- A system for custom report generation
- A flexible charting and data exploration tool.
The ROI editor and image-viewers used our [React](https://reactjs.org/) medical image user-interface library.
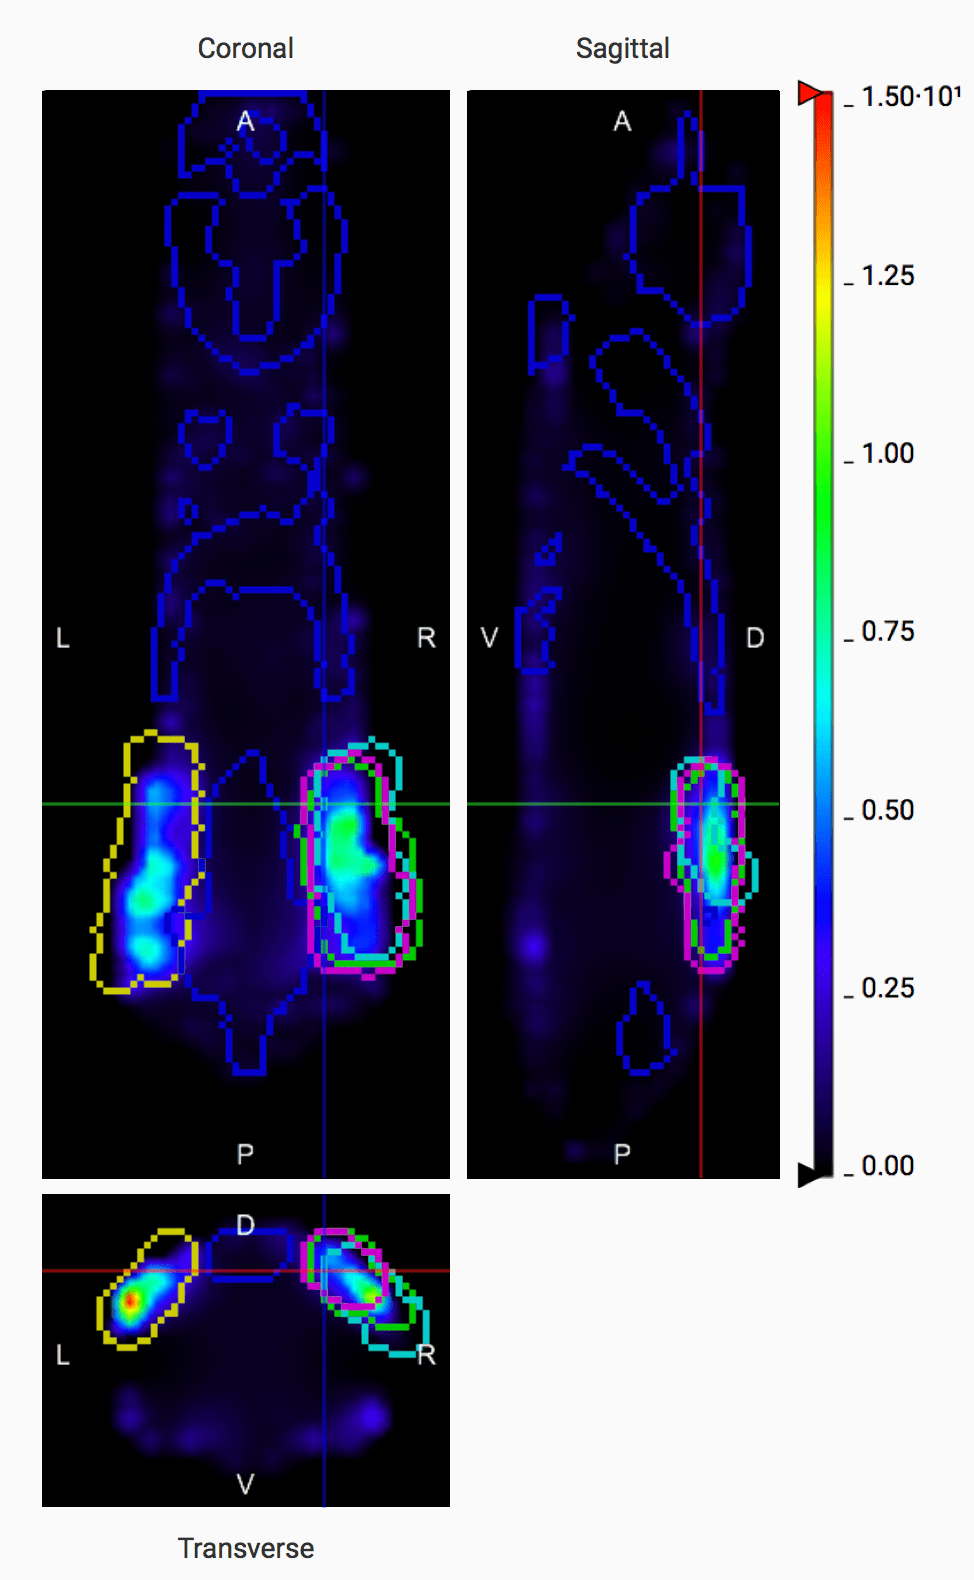
An interactive, web-based 3D ROI editor. Users modify the regions of
images that are important for analysis using an intuitive, Microsoft
Paint-like interface.InVivoPlot hardware simplifies tomographic imaging of bioluminescent
reporters in small animals by enabling the capture of four simultaneous
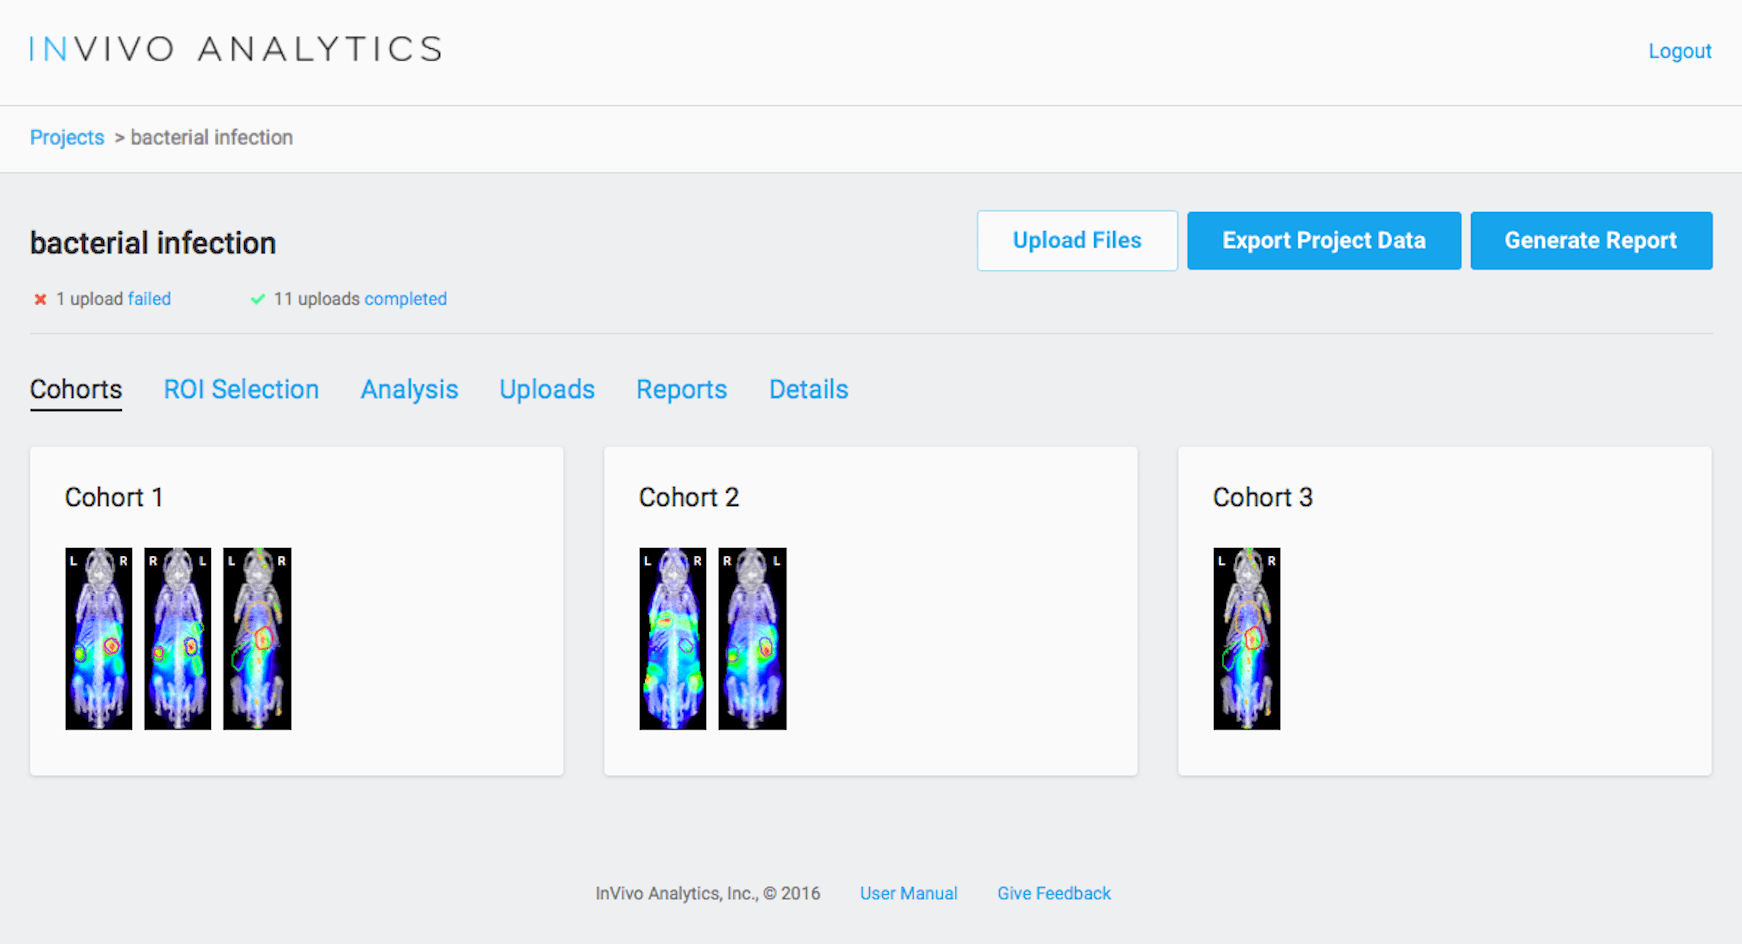
images.The web application streamlines statistical analysis in preclinical
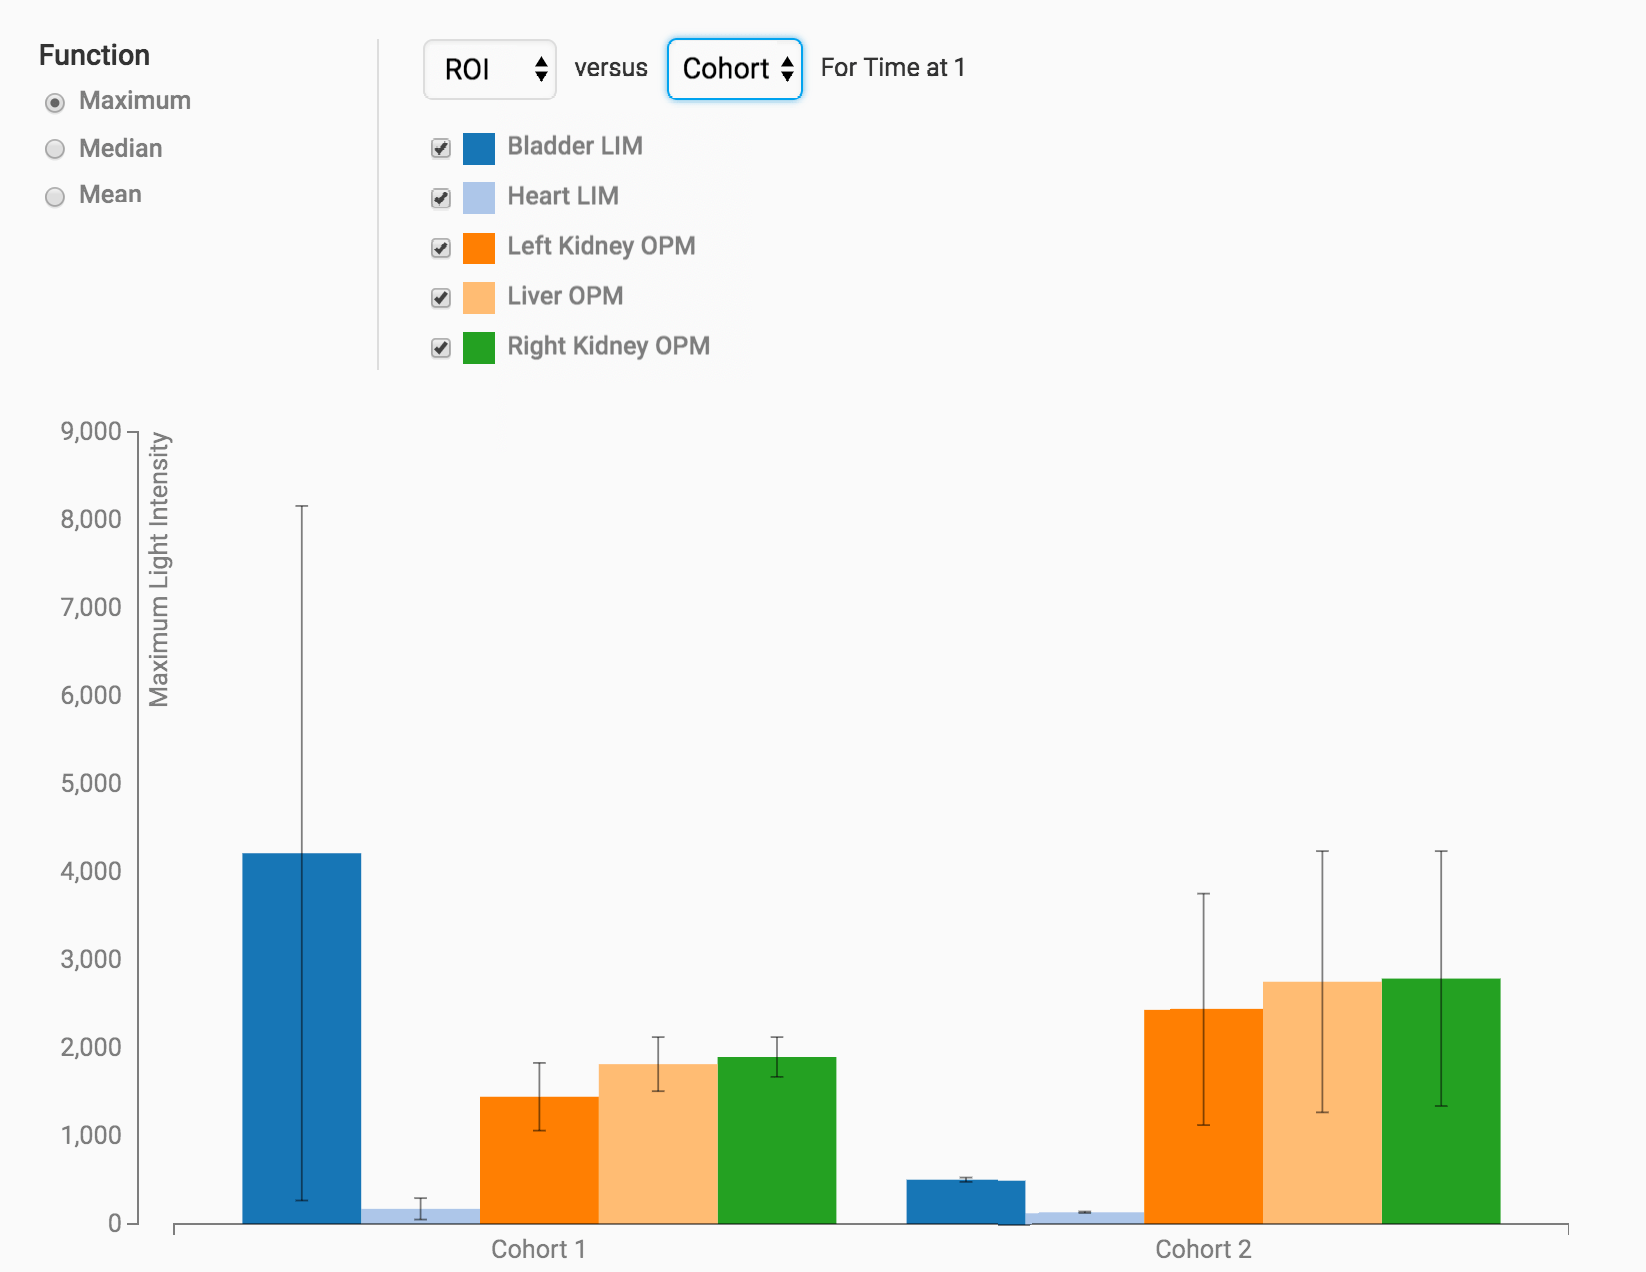
imaging studies where animals are divided into cohorts.Various metrics are calculated based on the ROIs set for each
project, cohort, and image. The data from these charts is also exported
in CSV files.