![]()
"What will an FDA clearance cost?" We estimate $1.65M (keep reading for a breakdown).
However, a more interesting question is: "What will an FDA clearance earn?"
If you treat regulatory as a cost center and every decision bends toward minimizing spend. You delay the submission to preserve runway. You chase risky loopholes to avoid filing at all. You find the cheapest consultants on the market, then burn weeks comparing quotes. By the time you’re ready, the competitor is already cleared and show up to the trade show with an order book while you show up with a “research use only” sticker. You undercapitalized the highest-leverage line item on your balance sheet, and now you own the consequences.
If you treat regulatory as a profit center you’ll move fast, scope the indication for maximum strategic impact, hire the team that has shipped one before, and engineer the submission to win on the first try. It is like putting in a strong, competitive offer for the candidate you actually want. They accept fast, ramp up, and start shipping while the lowball hirers are still wondering why no one will return their calls. Could it have been done cheaper? Sure. But you’ll be waiting a long time while the market moves on.
That is the thesis. Now the proof.
The Numbers 🔗
We pulled 35 major AI/ML Software as a Medical Device (SaMD) clearances from publicly traded companies, since the market reaction is observable and quantifiable. We tracked pre- and post-clearance market caps across three time windows. We applied a conservative attribution discount to separate the regulatory event from concurrent catalysts. Then we compared the resulting equity creation against the all-in cost of a submission.
The headline result: a combined submission cost of $51.2 million produced $1.54 billion in attributable equity value within 14 trading days, a 30.0x cohort ROI (90 percent confidence interval 2.3x to 63.7x). Extend the window to 63 trading days and the cohort ROI grows to 40.9x. The mechanism is not a single home run. It is a portfolio: 65 percent of clearances generated a net positive market-cap delta within three weeks, and the cohort total compounds across the wins and losses alike.
Clearances also unlock the liquidity required to actually realize those returns. Across the same 35 events, our cohort traded $2.77 billion of incremental dollar volume above baseline in the +14 trading day windows. That is the trading tape founders, employees, and early investors need in order to exit positions, rebalance funds, or finance the next round.
The Dataset 🔗
We analyzed 35 publicly disclosed regulatory events where the FDA decision date occurred after the company's IPO, ensuring the subsequent public market response was quantifiable. Stock prices move for many reasons, so we applied a uniform 30 percent attribution share to each event: if a company announced a clearance, we attributed only a fraction of the subsequent market-cap move to the clearance itself. The rest of the analysis works in raw dollars. Each event gets measured in $M of attributable equity, and we aggregate wins and losses into a single cohort ROI: total dollars created divided by total dollars of submission cost.
| Company | Ticker | Post-IPO Clearances | Total Submission Cost | Total Attributable Equity (+14td) | Cohort ROI |
|---|---|---|---|---|---|
| Tempus AI | TEM | 3 | $5.0M | $1,163M | 233x |
| Nano-X Imaging | NNOX | 6 | $9.9M | $52M | 5.3x |
| 4DMedical | 4DX.AX | 2 | $3.3M | $152M | 46x |
| Butterfly Network | BFLY | 3 | $5.0M | $127M | 25x |
| Hyperfine | HYPR | 11 | $18.2M | $26M | 1.4x |
| HeartBeam | BEAT | 2 | $3.3M | $14M | 4.2x |
| Artrya | AYA.AX | 2 | $3.3M | $16M | 5.0x |
| Median Technologies | ALMDT.PA | 1 | $1.65M | $7.5M | 4.5x |
| Echo IQ | EIQ.AX | 1 | $1.65M | -$0.6M | -0.4x |
| Lunit | 328130.KQ | 4 | $4.95M | -$18M | -3.6x |
Assumptions: Costs are modeled at $1.65M for Traditional 510(k)s, $1.0M for Special 510(k)s, $2.5M for De Novos, and $5.0M for PMAs. Cohort ROI per company is total attributable equity at +14td divided by total submission cost. All-in submission costs are modeled estimates for major AI/ML SaMD programs from publicly traded companies. These figures include clinical and performance studies, regulatory consulting, testing/validation, quality-system work, and internal resources. They do not reflect only FDA user fees (which are typically ~$24k–$26k for a 510(k) and ~$162k for a De Novo in FY2025). Actual costs vary widely depending on device complexity and development approach.
Limitations: This analysis focuses on post-IPO publicly traded companies so that market-cap reactions are observable and quantifiable. The uniform 30% attribution share applied to each event is intentionally conservative and does not prove strict causation because stock prices move for many reasons. Results reflect a portfolio effect across wins and losses; individual clearances can (and do) vary significantly in outcome.
Per-event stock reaction 🔗
35 post-IPO AI/ML SaMD clearances. 14 trading day window. Cohort ROI: +14td peak 52.3x, +14td close 30.0x.
| # | Company | Ticker | K-number | Type | Device | Decision | Pre | Peak | Peak Attrib $M | Close Attrib $M |
|---|---|---|---|---|---|---|---|---|---|---|
| 1 | Hyperfine | HYPR | K221393 | Special | Swoop Portable MR Imaging System | 2022-06-10 | $2.20 | $2.70 | +$0.7M | +$0.7M |
| 2 | Hyperfine | HYPR | K220815 | Traditional | BrainInsight | 2022-07-19 | $1.57 | $1.89 | +$7.2M | +$7.2M |
| 3 | Hyperfine | HYPR | K221923 | Special | Swoop Portable MR Imaging System | 2022-07-28 | $1.28 | $1.92 | +$14M | +$4.5M |
| 4 | Hyperfine | HYPR | K223247 | Special | Swoop Portable MR Imaging System | 2022-12-06 | $0.73 | $1.23 | +$11M | +$3.6M |
| 5 | Hyperfine | HYPR | K223268 | Traditional | BrainInsight | 2022-12-16 | $0.80 | $0.89 | +$2.0M | +$1.1M |
| 6 | Hyperfine | HYPR | K230208 | Special | Swoop Portable MR Imaging System | 2023-02-22 | $1.38 | $1.88 | +$11M | +$5.0M |
| 7 | Hyperfine | HYPR | K232760 | Special | Swoop Portable MR Imaging System | 2023-10-06 | $1.90 | $1.97 | +$1.6M | -$4.3M |
| 8 | Hyperfine | HYPR | K240944 | Special | Swoop Portable MR Imaging System | 2024-07-16 | $1.06 | $1.24 | +$4.1M | +$2.0M |
| 9 | Hyperfine | HYPR | K251276 | Special | Swoop Portable MR Imaging System | 2025-05-21 | $0.62 | $0.86 | +$5.4M | +$4.0M |
| 10 | Hyperfine | HYPR | K250236 | Traditional | Swoop Portable MR Imaging System | 2025-05-30 | $0.60 | $0.86 | +$6.0M | +$2.3M |
| 11 | Hyperfine | HYPR | K253489 | Special | Swoop Portable MR Imaging System | 2025-12-12 | $1.00 | $1.10 | +$2.3M | -$0.7M |
| 12 | Nano-X Imaging | NNOX | K203782 | Traditional | Nanox Cart X-ray System | 2021-04-01 | $41.45 | $48.55 | +$124M | -$143M |
| 13 | Nano-X Imaging | NNOX | K213944 | Traditional | HealthOST | 2022-04-22 | $10.17 | $11.03 | +$15M | -$17M |
| 14 | Nano-X Imaging | NNOX | K222934 | Traditional | Nanox.ARC | 2023-04-28 | $6.13 | $19.89 | +$239M | +$195M |
| 15 | Nano-X Imaging | NNOX | K242395 | Traditional | Nanox.ARC | 2024-12-04 | $6.01 | $8.38 | +$41M | +$18M |
| 16 | Nano-X Imaging | NNOX | K250850 | Traditional | Nanox.ARC X | 2025-05-16 | $4.70 | $5.32 | +$11M | +$4.0M |
| 17 | Nano-X Imaging | NNOX | K252649 | Traditional | TAP2D | 2026-02-02 | $2.73 | $2.72 | -$0.2M | -$5.2M |
| 18 | Butterfly Network | BFLY | K220068 | Traditional | Butterfly iQ/iQ+ Ultrasound System | 2023-03-31 | $1.64 | $2.82 | +$82M | +$50M |
| 19 | Butterfly Network | BFLY | K232888 | Traditional | Butterfly iQ3 Ultrasound System | 2024-01-04 | $1.02 | $1.22 | +$14M | -$2.2M |
| 20 | Butterfly Network | BFLY | K252148 | Traditional | Butterfly Gestational Age Tool | 2026-03-27 | $4.15 | $5.29 | +$79M | +$79M |
| 21 | Tempus AI | TEM | K233549 | Traditional | Tempus ECG-AF | 2024-06-21 | $27.26 | $37.50 | +$507M | +$507M |
| 22 | Tempus AI | TEM | K250119 | Traditional | Tempus ECG-Low EF | 2025-07-15 | $57.82 | $64.86 | +$348M | -$145M |
| 23 | Tempus AI | TEM | K241868 | Traditional | xR IVD | 2025-09-19 | $87.07 | $103.25 | +$801M | +$801M |
| 24 | Lunit | 328130 | K231470 | Traditional | Lunit INSIGHT DBT | 2023-11-06 | 90,300 | 96,600 | +$30M | +$0.0M |
| 25 | Lunit | 328130 | K242652 | Special | Lunit INSIGHT DBT v1.1 | 2024-10-04 | 43,650 | 43,000 | -$3.1M | -$27M |
| 26 | Lunit | 328130 | K253796 | Traditional | Lunit INSIGHT DBT (V1.2) | 2026-03-26 | 35,100 | 37,100 | +$9.6M | +$8.9M |
| 27 | Lunit | 328130 | K260320 | Special | Lunit INSIGHT MMG (v1.1.10) | 2026-04-23 | 35,950 | 35,750 | -$1.0M | n/a |
| 28 | 4DMedical | 4DX | K232392 | Traditional | CT Lung Ventilation Analysis Software | 2023-11-16 | AUD 0.67 | AUD 1.00 | +$33M | +$27M |
| 29 | 4DMedical | 4DX | K251484 | Traditional | CT:VQ | 2025-08-28 | AUD 0.51 | AUD 2.31 | +$183M | +$125M |
| 30 | HeartBeam | BEAT | K231424 | Traditional | HeartBeam AIMIGo(TM) System | 2024-12-13 | $3.05 | $3.12 | +$1.1M | -$13M |
| 31 | HeartBeam | BEAT | K250258 | Traditional | HeartBeam AIMIGo with 12-L ECG synthesis | 2025-12-08 | $0.73 | $3.44 | +$42M | +$27M |
| 32 | Artrya | AYA | K243038 | Traditional | Salix Central | 2025-03-27 | AUD 0.82 | AUD 0.87 | +$1.2M | -$3.7M |
| 33 | Artrya | AYA | K251837 | Traditional | Salix Coronary Plaque (V1.0.0) | 2025-08-20 | AUD 1.34 | AUD 2.22 | +$21M | +$20M |
| 34 | Echo IQ | EIQ | K241245 | Traditional | EchoSolv AS | 2024-10-04 | AUD 0.25 | AUD 0.31 | +$3.9M | -$0.6M |
| 35 | Median Technologies | ALMDT | K251474 | Traditional | Median LCS | 2026-02-06 | EUR 4.30 | EUR 6.59 | +$21M | +$7.5M |
Cohort total: 35 submissions. Cost: $51.2M. Attributable equity at +14td peak: $2.68B. Attributable equity at +14td close: $1.54B. Net positive: 22/35 (65 percent). Attributable equity = (post-clearance price minus pre-clearance close) × shares outstanding × 30 percent attributable share. Pre and Peak shown in local currency; attributable equity in USD millions.
What Goes Into a $1.65M 510(k) 🔗
The $1.65 million figure used throughout this analysis is not the FDA user fee. The user fee is a small fraction of the total: under MDUFA V, the FY2026 standard 510(k) fee is $26,067 ($6,517 for CDRH-certified small businesses), and the De Novo standard fee is $173,782 (Federal Register, July 30, 2025). Everything else is the cost of producing the evidence and documentation reviewers expect to see.
For a traditional 510(k) covering an AI/ML SaMD with typical scope, an indicative breakdown looks like this. Numbers move with indication, novelty, and how much existing infrastructure you already have.
- FDA user fee: ~$26K. Standard 510(k) under MDUFA V FY2026. Small-business rate is ~$6.5K. De Novo equivalent is ~$174K standard / ~$43K small business.
- Regulatory strategy and submission authoring: ~$250K–$400K. Pre-Submission package and FDA meeting, indication scoping, predicate analysis, the substantial-equivalence argument, and assembling the full eSTAR (required for 510(k) submissions since October 2023, and for De Novos since October 2025). For AI-enabled devices, FDA's January 2025 draft guidance Artificial Intelligence-Enabled Device Software Functions: Lifecycle Management and Marketing Submission Recommendations lays out the additional sections reviewers expect: model description, training and reference data, performance metrics, generalization analysis, and post-market monitoring.
- Clinical and performance validation: ~$400K–$700K. The single biggest line item for most AI SaMD. Curating and adjudicating an independent test set, running the standalone performance study, executing a multi-reader multi-case (MRMC) study if the indication requires one, and statistical analysis. Test design follows FDA's Good Machine Learning Practice for Medical Device Development guiding principles (FDA / Health Canada / MHRA, October 2021) and the AI lifecycle draft above. Costs scale with reader count, case count, and adjudication complexity. You should roughly double this for a De Novo.
- Software V&V, cybersecurity, and usability: ~$200K–$350K. IEC 62304 software lifecycle artifacts (verification protocols, traceability, unit and integration tests), cybersecurity per FDA's Cybersecurity in Medical Devices: Quality System Considerations and Content of Premarket Submissions final guidance (most recently updated February 2026, with SBOM, threat model, and penetration testing required by section 524B of the FD&C Act for cyber devices), and IEC 62366-1 usability and human-factors evaluation.
- Quality system work: ~$150K–$300K. 21 CFR 820, the Quality Management System Regulation (QMSR), effective February 2, 2026 and incorporating ISO 13485:2016 by reference, plus the risk management file (ISO 14971), DHF assembly, and the QMS infrastructure the submission references. Lower if you already have a mature QMS; meaningfully higher if this is your first device.
- Internal team time: ~$200K–$400K. Loaded cost of your own engineers, regulatory lead, clinical lead, and PM allocated to the program over 9–15 months. This cost is likely the same if you are working with partners instead of hiring internally.
- Contingency for additional information and lifecycle planning: ~$50K–$150K. Reviewers nearly always come back with questions; budget at least one round of AI (Additional Information) responses and a possible hold on the 90-day review clock. If your device will evolve through retraining or model updates, also plan for a Predetermined Change Control Plan (PCCP) per FDA's December 2024 final guidance (updated August 2025). You should roughly double this for a De Novo.
The cost is dominated by evidence generation, not by what FDA charges to look at it. Qualifying as a CDRH-certified small business saves you roughly $20K on the user fee. Cutting your clinical study scope in half might save $200K–$350K — but it can also cost you the clearance, which is the only outcome that matters.
Three Windows of Value 🔗
Day one press releases are noise. Real revaluation takes weeks.
We measured the market cap delta across three horizons.
- The immediate pop (+1 trading day). Only 37 percent of events were net positive on day one. The cohort total attributable equity was just $34M, against $51M of submission cost. Cohort ROI: 0.7x. Markets do not reprice a medical device company on a regulatory headline alone.
- The attribution window (+14 trading days). Roughly three calendar weeks. The most defensible attribution horizon. Long enough for analysts to update their models, short enough to escape multi-quarter confounds. At this mark, 65 percent of events were net positive, with $1.54 billion of attributable equity created across the cohort. Cohort ROI: 30.0x (90 percent CI 2.3x to 63.7x).
- The +3 month window (+63 trading days). Roughly three calendar months. This shows whether the clearance translated into sustained commercial momentum. At this mark, 55 percent of events were net positive, with $2.10 billion of attributable equity. Cohort ROI: 40.9x. The biggest contributors are the events where the clearance unlocked a sustained re-rating, not just a pop.
![]()
Case study: Butterfly Network 🔗
Take Butterfly. On March 30, 2026, Butterfly announced FDA clearance for its Gestational Age tool.
![]()
The day before, Butterfly was worth roughly $960 million. The day after, the stock was down 5.5 percent. Three weeks later, it had climbed to roughly $1.22 billion. It pushed higher into late April, peaking near $1.4 billion in market cap over the 63 day window.
![]()
Inside the strict 14 trading day attribution window, that is $264.8 million of market cap appreciation. Attribute a conservative 30 percent of that to the clearance and you still get $79 million in attributable equity off a single $1.65 million submission. Before a single new unit ships under the new label, the submission has already paid for itself many times over.
Wall Street Treats Clearances as Buy Signals 🔗
When Tempus AI secured 510(k) clearance for its updated Pixel cardiac imaging platform in September 2025, H.C. Wainwright raised its price target from $90 to $98, Buy reiterated, with the clearance named as the catalyst.
![]()
Two months later, BTIG analyst Mark Massaro raised his Tempus target from $96 to $105, pointing at Pixel and a follow-on ECG-Low ejection fraction clearance as the growth drivers.
![]()
The pattern holds sector wide. As HeartBeam approached FDA clearance for its 12-lead ECG synthesis software in late 2025, ROTH Capital initiated coverage with a Buy rating and a $4 price target ahead of the anticipated FDA clearance.
![]()
For 4DMedical, the FDA 510(k) clearance for CT:VQ lung imaging plus CMS Category III reimbursement triggered a wave of upgrades. By late October 2025, the consensus 4DMedical price target had jumped 27 percent, going from A$1.43 to A$1.82 per share.
![]()
Even the giants get rerated. When GE HealthCare secured FDA clearance for its Photonova Spectra photon-counting CT system in March 2026, Stifel reiterated Buy and a $98 target. The stock jumped 6.19 percent intraday on the note and the milestone.
![]()
For Hyperfine, B. Riley analyst Yuan Zhi reiterated Buy with a $1 target in June 2025, anchored on the FDA 510(k) clearance for the Swoop next-generation system.
![]()
When William Blair initiated coverage on Butterfly Network, analyst Andrew Brackmann tied the Outperform thesis directly to the company's FDA-cleared portfolio, writing that the clearances expanded the uses and opportunities for its technology substantially.
![]()
Analysts don’t treat regulatory affairs as a compliance checklist. They treat a clearance as a de-risking event that opens up the TAM and justifies a higher multiple, and they say it in print every time.
Liquidity: The Hidden Half of the Return 🔗
Across the 35 events, one of them (the first Tempus clearance) was announced right after an IPO so there was no trading data available for the +/- 14 day window. Therefore, this table only shows 34.
| Company | Ticker | K-number | Decision Date | Pre 14td Avg Daily Shares | Post 14td Avg Daily Shares | Lift |
| 4DMedical | 4DX.AX | K232392 | 2023-11-16 | 1.17M | 2.02M | 1.73x |
| 4DMedical | 4DX.AX | K251484 | 2025-08-28 | 2.77M | 18.37M | 6.64x |
| Artrya | AYA.AX | K243038 | 2025-03-27 | 193K | 547K | 2.84x |
| Artrya | AYA.AX | K251837 | 2025-08-20 | 380K | 1.02M | 2.68x |
| Butterfly Network | BFLY | K220068 | 2023-03-31 | 1.61M | 7.56M | 4.69x |
| Butterfly Network | BFLY | K232808 | 2024-01-04 | 2.44M | 1.88M | 0.77x |
| Butterfly Network | BFLY | K252148 | 2026-03-27 | 4.41M | 4.36M | 0.99x |
| Echo IQ | EIQ.AX | K241245 | 2024-10-04 | 3.76M | 6.62M | 1.76x |
| HeartBeam | BEAT | K231424 | 2024-12-13 | 114K | 357K | 3.15x |
| HeartBeam | BEAT | K250258 | 2025-12-08 | 9.58M | 45.81M | 4.78x |
| Hyperfine | HYPR | K221393 | 2022-06-10 | 62K | 243K | 3.94x |
| Hyperfine | HYPR | K220815 | 2022-07-19 | 180K | 412K | 2.28x |
| Hyperfine | HYPR | K221923 | 2022-07-28 | 338K | 315K | 0.93x |
| Hyperfine | HYPR | K223247 | 2022-12-06 | 167K | 731K | 4.39x |
| Hyperfine | HYPR | K223268 | 2022-12-16 | 785K | 122K | 0.15x |
| Hyperfine | HYPR | K230208 | 2023-02-22 | 3.03M | 785K | 0.26x |
| Hyperfine | HYPR | K232760 | 2023-10-06 | 87K | 96K | 1.11x |
| Hyperfine | HYPR | K240944 | 2024-07-16 | 225K | 135K | 0.60x |
| Hyperfine | HYPR | K251276 | 2025-05-21 | 395K | 8.73M | 22.09x |
| Hyperfine | HYPR | K250236 | 2025-05-30 | 674K | 8.59M | 12.75x |
| Hyperfine | HYPR | K253489 | 2025-12-12 | 624K | 814K | 1.31x |
| Lunit | 328130.KQ | K231470 | 2023-11-06 | 833K | 924K | 1.11x |
| Lunit | 328130.KQ | K242652 | 2024-10-04 | 708K | 227K | 0.32x |
| Lunit | 328130.KQ | K253796 | 2026-03-26 | 162K | 123K | 0.75x |
| Lunit | 328130.KQ | K260320 | 2026-04-23 | 150K | 541K | 3.61x |
| Median Technologies | ALMDT.PA | K251474 | 2026-02-06 | 347K | 1.04M | 2.99x |
| Nano-X Imaging | NNOX | K203782 | 2021-04-01 | 1.62M | 4.78M | 2.96x |
| Nano-X Imaging | NNOX | K213944 | 2022-04-22 | 1.11M | 502K | 0.45x |
| Nano-X Imaging | NNOX | K222934 | 2023-04-28 | 481K | 7.00M | 14.56x |
| Nano-X Imaging | NNOX | K242395 | 2024-12-04 | 1.49M | 5.78M | 3.88x |
| Nano-X Imaging | NNOX | K250850 | 2025-04-16 | 1.53M | 1.02M | 0.66x |
| Nano-X Imaging | NNOX | K252649 | 2026-02-02 | 1.13M | 1.31M | 1.16x |
| Tempus AI | TEM | K250119 | 2025-07-15 | 9.07M | 8.92M | 0.98x |
| Tempus AI | TEM | K241868 | 2025-09-19 | 8.28M | 9.65M | 1.16x |
Cohort statistics across 34 events 🔗
| Statistic | Value | 90% bootstrap CI |
| Mean lift per event | 3.37x | 2.22x to 4.74x |
| Median lift per event | 1.74x | 1.11x to 2.96x |
| Cohort aggregate lift | 2.53x | n/a |
| Share of events with positive lift | 68% | n/a |
The cohort aggregate is the operational number: across all 34 events, the cohort traded 2.53x as many shares per day in the two weeks after a clearance as it did in the two weeks before (151.3 million average daily shares post-event versus 59.9 million pre-event). Two thirds of clearances opened a positive liquidity window.
Price tells you what the market thinks the company is worth. Volume tells you whether anyone can actually trade on that opinion. For founders, employees, board observers, and early investors, the ability to exit a position without crushing the price is just as valuable as the price itself.
FDA clearances do not just move the stock. They wake up the order book.
Standout liquidity events 🔗
Ranked by absolute $M of incremental dollar volume traded above baseline in the +14td window:
1.Nano-X Imaging, April 2021. First post-IPO clearance (K203782) opened +$1.55 billion of incremental dollar volume above baseline. The IPO had only just placed the float; the FDA clearance announced the company to the institutional market.
2.Nano-X Imaging, April 2023. Clearance K222934 added +$1.33 billion of incremental dollar volume. Pre-event $3.2M daily dollar volume. Post-event roughly $98M daily.
3.HeartBeam, December 2025. The 12-lead ECG synthesis 510(k) (K250258) added +$1.29 billion. The clearance announcement was a liquidity event in its own right.
4.4DMedical, August 2025. CT:VQ clearance (K251484) added +$249 million of incremental dollar volume, going from roughly A$0.7M average daily dollar volume to A$18.5M.
5.Lunit, November 2023. First clearance (K231470) added +$198 million of incremental dollar volume on KOSDAQ.
And the cautionary tape: Tempus K250119 in July 2025 actually removed $2.55 billion of dollar volume from the +14td window relative to baseline, as a Pixel-platform clearance landed into an already-crowded long position and triggered profit taking. Liquidity is upside and downside. The window is real either way; what an investor or insider does with it depends on the position they came in with.
The Private Market Multiplier 🔗
Private markets are noisier and harder to chart. The relationship is even tighter. For private AI SaMD startups, an FDA clearance is often the literal gating milestone for the next round, or even the exit. This is the difference between life and death for many earlier stage companies.
A few recent timelines:
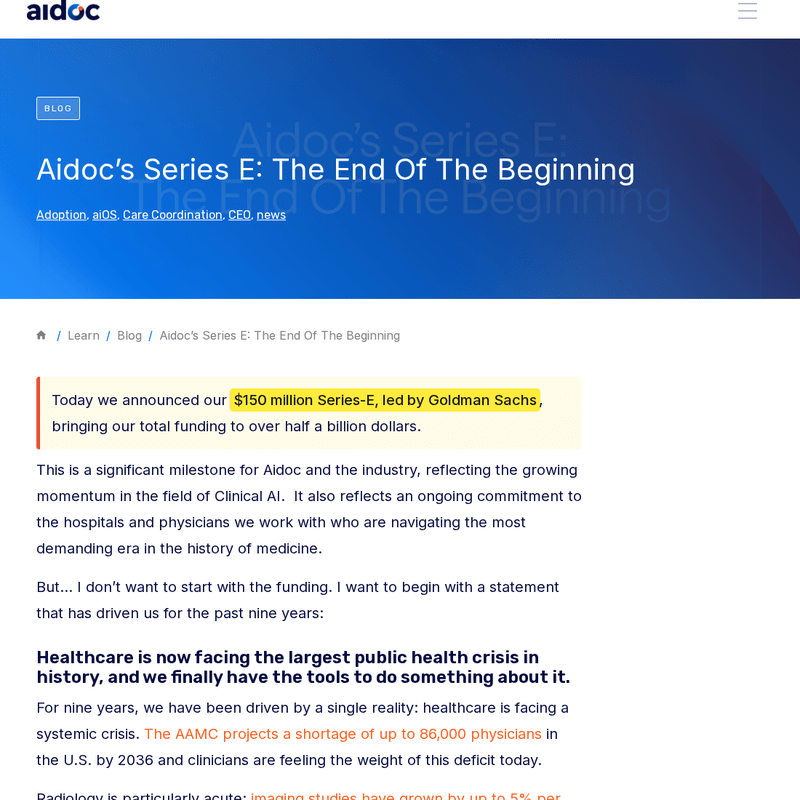
-
Aidoc's $150M Series E. January 2026: Aidoc secured a landmark FDA clearance for its CARE foundation model, covering 11 newly cleared indications. Three months later, in April 2026, Aidoc closed a $150 million Series E led by Goldman Sachs Alternatives. Clearance proved the platform scaled. Capital followed.
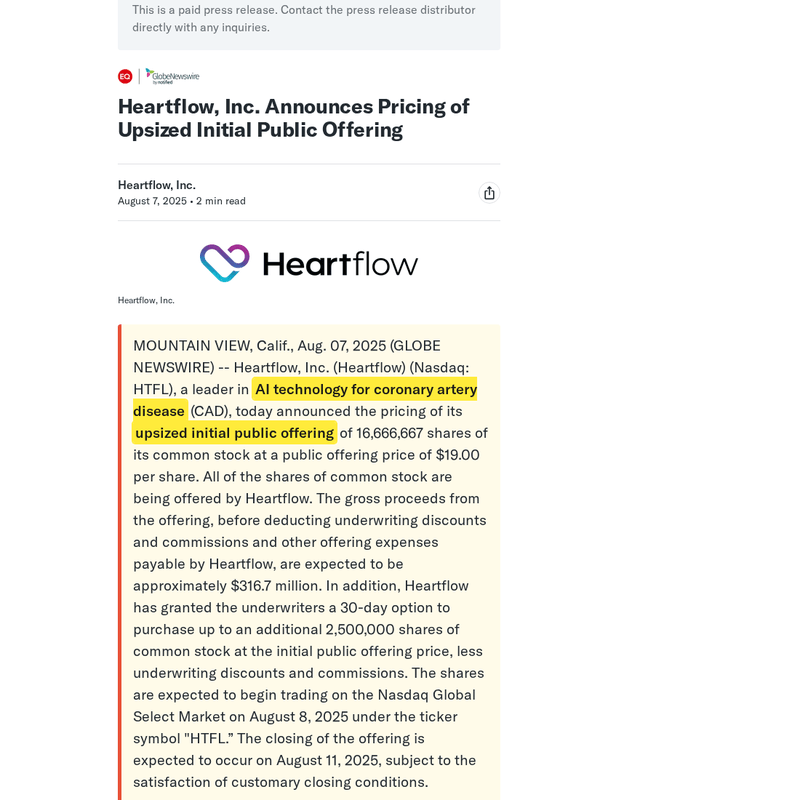
-
HeartFlow's $1.54B IPO. July 18, 2025: HeartFlow secured an updated FDA clearance for its Plaque Analysis platform. August 7, twenty days later: the company priced an upsized $316.7 million IPO at a $1.54 billion implied valuation. The stock surged 58 percent in its first two days.
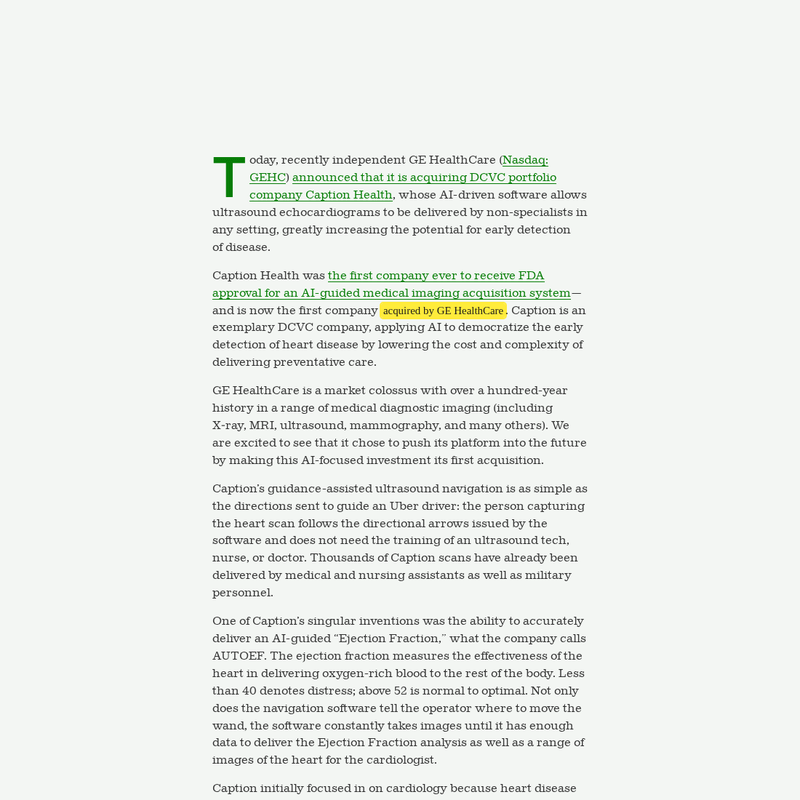
-
Caption Health's acquisition. Caption secured a De Novo for AI-guided ultrasound in February 2020, an expedited follow-on in May 2020, and a $53 million Series B immediately after. Three years later, GE HealthCare acquired the company and folded the cleared AI into its $3 billion ultrasound business.
-
Cleerly's $106M Series C extension. Cleerly built its foundation on multiple FDA-cleared cardiovascular AI products. December 2024: a $106 million Series C extension led by Insight Partners, bringing total funding past $400 million.
- Vista AI's $29.5M Series B. January 2026: $29.5 million explicitly to build on its FDA-cleared and commercially available cardiac MRI platform. The clearance was the prerequisite, not the consequence.
![]()
-
a2z Radiology AI's seed round. December 2025: a Boston startup closed a $4.5 million seed fresh off its first FDA clearance. The regulatory win was the catalyst that closed the round.
Conclusion: Budget Against What It Earns 🔗
Leaders: stop asking your VP of Regulatory how much a submission costs. Start asking yourself how much it will earn. Here is the proof:
- Across 35 post-IPO AI/ML SaMD clearances, a combined $51.2 million of submission cost produced $1.54 billion of attributable equity within 14 trading days (a 30.0x cohort ROI, 90 percent CI 2.3x to 63.7x), growing to $2.10 billion and 40.9x at 63 trading days. 65 percent of clearances were net positive at the three-week mark; 55 percent stayed net positive at three months. Day-one pops are noise — only 37 percent of events were green on +1td and the cohort ROI was just 0.7x — but real revaluation lands on the multi-week horizon.
- On the 34 events that had at least a 2 week trading history, the cohort traded $2.77 billion of incremental dollar volume above baseline in the +14td window, a 2.53x cohort liquidity lift, with 68 percent of events opening a positive trading window.
- In private markets the relationship is even tighter: across eight directly traceable post-clearance financings (Tempus pre-IPO C, HeartFlow Series E, Aidoc Series E, Cleerly Series C extension, Viz.ai Series D, Rad AI Series C, Caption Series B, Vista AI Series B), companies raised $1.12 billion of fresh capital within 12 months of an FDA clearance, with a $103 million median round — gating financings that dwarf the submission cost by two to three orders of magnitude.
- A traditional 510(k) for an AI software only medical device is roughly $1.65 million all-in (see What Goes Into a $1.65M 510(k) above for the line-item breakdown).
If you are building AI SaMD, the 510(k) or De Novo is one of the highest-leverage line items on your balance sheet. Capitalize it accordingly.
The asymmetry is the point. The cohort averaged roughly $44M of attributable equity per event in the +14 trading day window. Discount that hard (for selection bias, for company-specific catalysts, for the wide variance across the cohort) and the expected value of a clearance is still large enough that small delays are difficult to justify on cost grounds alone. Trading 20 percent out of a $1.65M submission saves roughly $330K but will likely cost you months (or years) of time. A few fractions of a percent of expected value on a multi-million-dollar event clears that bar quickly.
For private companies, the calculation is even simpler. The next round is, in most cases, gated on the clearance. You told your investors you would clear by a specific date and that promise funded this milestone in the first place. Miss it by a quarter and the round slips a quarter. Miss it by two and the round may not close at all. The realistic downside is not "saved $330K on vendor selection." It is up to a year of additional runway burn, a broken commitment to the investors who backed you, and a down round when (or if) you finally raise.
So: hire a cross functional team that has cleared many more before. Pay a competitive price. File on the earliest credible date the work supports. In most situations, the probability-weighted upside of moving sooner outweighs what you can realistically save by stretching procurement.