Many medical applications run within a closed network. This arrangement can make investigating software bugs more difficult because the only readily available information is an (often vague and incomplete) recounting of the problem, a zip file filled with system and application logfiles, and the application source code.
We can also attempt to reproduce the issue on the on a staging server, however, the challenging bugs are not easy to reproduce. Finally, if we must, we can gain access to the live server by coordinating with the hospital’s IT department. Ideally, we would deduce the cause of the problem before hand, so that we can save everyone time, energy, and—if the customer is in a distant timezone—sleep. Furthermore, the live server is often only useful once you have concrete theories you want to test, and such theories are best developed beforehand, when the client is not on the other line!
Logfiles can contain a wealth of information—if the application developers wrote useful log statements. Writing useful log statements is an art in and of itself, and we hope to write a thorough article on this topic sometime in the future. For now, it is worth noting that understanding how logfiles are analyzed is essential for writing useful log statements. After having been frustrated by missing information and overly verbose log statements while debugging issues, you are more likely to recognize what log statements are useful to include when developing an application.
I used to analyze logfiles using sed, grep, less, wc, sort, uniq,
and vim. Increasingly often, I rely on a tool called lnav.
Lnav is a powerful logfile analysis command-line tool. It solves a number of problems commonly encountered while analyzing logfiles:
- Overlapping many logfiles (with different formats) in time
- Efficiently browsing through large amounts of mostly irrelevant information
- Filtering out irrelevant portions of a log file (e.g. for a particular IP address)
- Extracting and recombining information in the logfiles to answer diagnostic questions.
Lnav is easy to install on both macOS and Linux.
To run lnav, you pass in the directory containing your log files. It will then deduce the logfile format (Syslog, sudo, Java log format, etc.) for each file from many built-in log formats. The means by which log formats is deduced is clever:
When lnav loads a file, it tries each log format against the first ~1000 lines of the file trying to find a match. When a match is found, that log format will be locked in and used for the rest of the lines in that file. Since there may be overlap between formats, lnav performs a test on startup to determine which formats match each others sample lines. Using this information it will create an ordering of the formats so that the more specific formats are tried before the more generic ones.
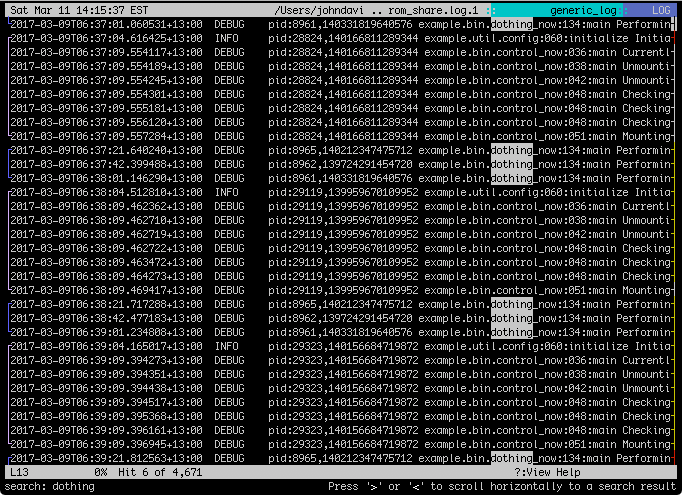
Once you have opened lnav, it interleaves the individual log statements together, and highlights semantic information for easy browsing.
The main part of the display shows the log lines from the files interleaved based on time-of-day. New lines are automatically loaded as they are appended to the files and, if you are viewing the bottom of the files, lnav will scroll down to display the new lines, much like ‘tail -f’.
On color displays, the lines will be highlighted as follows:
- Errors will be colored in red;
- warnings will be yellow;
- boundaries between days will be underlined; and
- various color highlights will be applied to: IP addresses, SQL keywords, XML tags, file and line numbers in Java backtraces, and quoted strings.
To give you an idea of where you are spatially, the right side of the display has a proportionally sized ‘scroll bar’ that indicates your current position in the files. The scroll bar will also show areas of the file where warnings or errors are detected by coloring the bar yellow or red, respectively. Tick marks will also be added to the left and right hand side of the bar, for search hits and bookmarks.
When multiple files are open, a bar on the left side is color coded and broken up to indicate which messages are from the same file.
Above and below the main body are status lines that display:
- the current time;
- the name of the file the top line was pulled from;
- the log format for the top line;
- the current view;
- the line number for the top line in the display;
- the current search hit and the total number of hits;
- the number of lines not displayed because of filtering.
Most of these UI components can be seen in the screenshot at the start of this article.
Lnav has keyboard shortcuts designed for quick browsing. Here are a few:
?                 View/leave this help message.
q                 Leave the current view or quit the program when in
                  the log file view.

g/home            Move to the top of the file.
G/end             Move to the end of the file.
space/pgdn        Move down a page.
b/bs/pgup         Move up a page.
j/cr/down-arrow   Move down a line.
k/up-arrow        Move up a line.
h/left-arrow      Move to the left.
l/right-arrow     Move to the right.

e/E               Move to the next/previous error.
w/W               Move to the next/previous warning.
n/N               Move to the next/previous search hit.

/<regexp>         Start a search for the given regular expression.

P                 Switch to/from the pretty-printed view of the log or text
                  files currently displayed.  In this view, structured data,
                  such as XML, will be reformatted to make it easier to read.

t                 Switch to/from the text file view.  The text file view is
                  for any files that are not recognized as log files.

i                 View/leave a histogram of the log messages over
                  time.  The histogram counts the number of
                  displayed log lines for each bucket of time.

z/Shift Z         Zoom in or out one step in the histogram view.

d/D               Move forward/backward 24 hours from the current
                  position in the log file.

0/Shift 0         Move to the next/previous day boundary.

r/R               Move forward/backward based on the relative time that
                  was last used with the 'goto' command.  For example,
                  executing ':goto a minute later' will move the log view
                  forward a minute and then pressing 'r' will move it
                  forward a minute again.

s/S               Move to the next/previous "slow down" in the log message
                  rate.  A slow down is detected by measuring how quickly
                  the message rate has changed over the previous several
                  messages.  For example, if one message is logged every
                  second for five seconds and then the last message arrives
                  five seconds later, the last message will be highlighted
                  as a slow down.
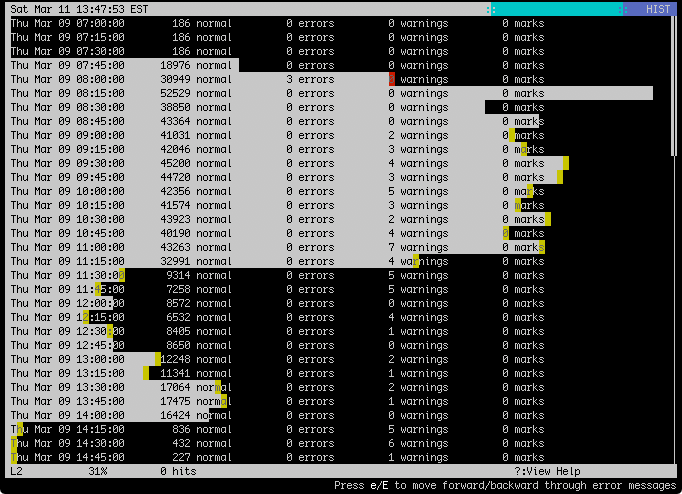
You may have noticed the keyboard shortcut for histogram mode. This feature allows you to view the frequency of errors, warnings, and other log statements, binned over time. Here is a screenshot of this feature:

Perhaps lnav’s most powerful feature is its built-in SQLite database.
By default, lnav provides a “virtual table” for each log file type. It is also possible to generate tables using regular expressions searches. Capturing groups from your searches become columns in the table. From within lnav, you can run SQL queries against these tables.
I have used this feature on many occasions, and have solved some very difficult to find bugs using it. It is particularly powerful in conjunction with lnav’s scripting feature.
Here is an example that illustrates lnav’s scripting and SQL features. It is a simplified version of a real issue I debugged using this technique.
Mar 11 00:15:20 INFO A:1003 file="12204A.dcm" size="599342"
Mar 11 00:15:50 INFO B:732 dir="/mnt/dicoms_aa32/88596E.dcm" size="2992931"
Mar 11 00:16:21 INFO A:1003 file="99213CA.dcm" size="168900"
Mar 11 00:16:31 INFO B:732 dir="/mnt/dicoms_aa32/12204A.dcm" size="9321045"
Mar 11 00:18:31 INFO B:732 dir="/mnt/dicoms_aa32/99213CA.dcm" size="772721"
Mar 11 00:18:32 INFO C:55 file="12204A.dcm" size="9920387"
I needed to know, for any given file, whether the size reported by
A plus the size reported by B add up to equal the
sizes reported by C.
To answer this, I played around in the lnav command-line for a while, and then wrote the following script:
#!/usr/bin/env lnav -nf

# NOTE: this script was adapted from another example, and I have not
# had a chance to validate that this is correct and working as written.

:create-search-table a A:1003 file="(?P<file>.*)\.dcm" size="(?P<size>.*)"
:create-search-table b B:732 dir="(.+/)*(?P<file>.*)\.dcm" size="(?P<size>.*)"
:create-search-table c C:55 file="(?P<file>.*)\.dcm" size="(?P<size>.*)"

;select a.file, c.size - b.size - a.size as diff
 from a join b using (file) join c using (file)
 where diff != 0;

:write-csv-to -
The shebang indicates that lnav should be run in non-interactive mode, and should execute the commands contained in the script. Note that although one may expect to need to cast the strings into integers in order to perform arithmetic on them, SQLite seems to cast them automatically. Also note that I wrapped the SQL query for easier reading, however, I don’t believe lnav supports this.
It may be possible to perform a similar analysis using standard command-line tools, however, I suspect it would be much more difficult. Lnav provides real-time feedback as you are developing your extraction regular expressions. Also, there is a clean separation between data extraction and analysis. If, after answering the first question, you have another, you can re-use the SQL tables easily because SQL is very generic.
I should note that lnav does take a while to get comfortable with, and I have run into a few small bugs with the SQL feature (it is still in beta), however, if you do a lot of logfile analysis, I believe it is worth investing the time learning.
A few pointers:
- Invalid regular expressions are interpreted as raw text. This can be confusing when you are debugging a script.
- Lnav has a command-line argument,
-d, that writes debugging information to a file. - You can view the available SQL tables by running the
.schema;query.
There are many more features that I won’t go into here. The lnav website has excellent documentation, so you can read about most of them there.
In summary, lnav is a powerful logfile analysis command-line tool. It can detect many different logfile formats, and it uses this information to interweave log statements chronologically. It has a useful histogram mode, and it allows you to analyze your logfiles using SQL.


