Introduction 🔗
Managing timelines and budgets for a medical-device project is uniquely challenging. Not only are there many disciplines involved—software, regulatory, clinical, quality, marketing—but also the regulatory environment introduces unique constraints into the timeline.
Medical-device timelines often slip for predictable reasons:
- Unknown work stays hidden until late in the project.
- No single owner is accountable for surfacing uncertainty.
- Tasks are too big to estimate, so dates are guesses and keep slipping.
At Innolitics, we’ve helped build and FDA-clear many medical devices. Often we’re working under extreme timelines, as with our Fast 510(k) solution where we complete a 510(k) in 3 months and our fees are tied to hitting these timelines. As you may imagine, we’ve become quite good at timeline management.
We’ve refined an approach to project management that avoids these issues. This article explains our opinionated approach. It’s written both as training for our staff and to be useful to early-stage medical-device founders and project managers.
Gantt chart structure and software 🔗
Use a Gantt chart to manage the project timeline. We use Medtech OS (built on Notion), but the tool matters less than the capabilities. (Tom’s Planner is another tool we like.) Your Gantt-charting tool must support:
- Nesting tasks (so the plan stays readable when there are hundreds of tasks)
- Tracking one owner per task (to set clear accountability)
- Dependencies (so you can see the critical path)
- Task Status (so the plan can be updated without rewriting it)
It is helpful, but not required, if the tool supports:
- Versioning (so you can look back at old versions)
- Automatic dependency timeline shifts (so that when an upstream task shifts, downstream tasks shift automatically)
- Shared source so everyone on the team can view and comment on tasks
- Hyperlinks (so you can link to other tools, or FDA guidance, etc.)
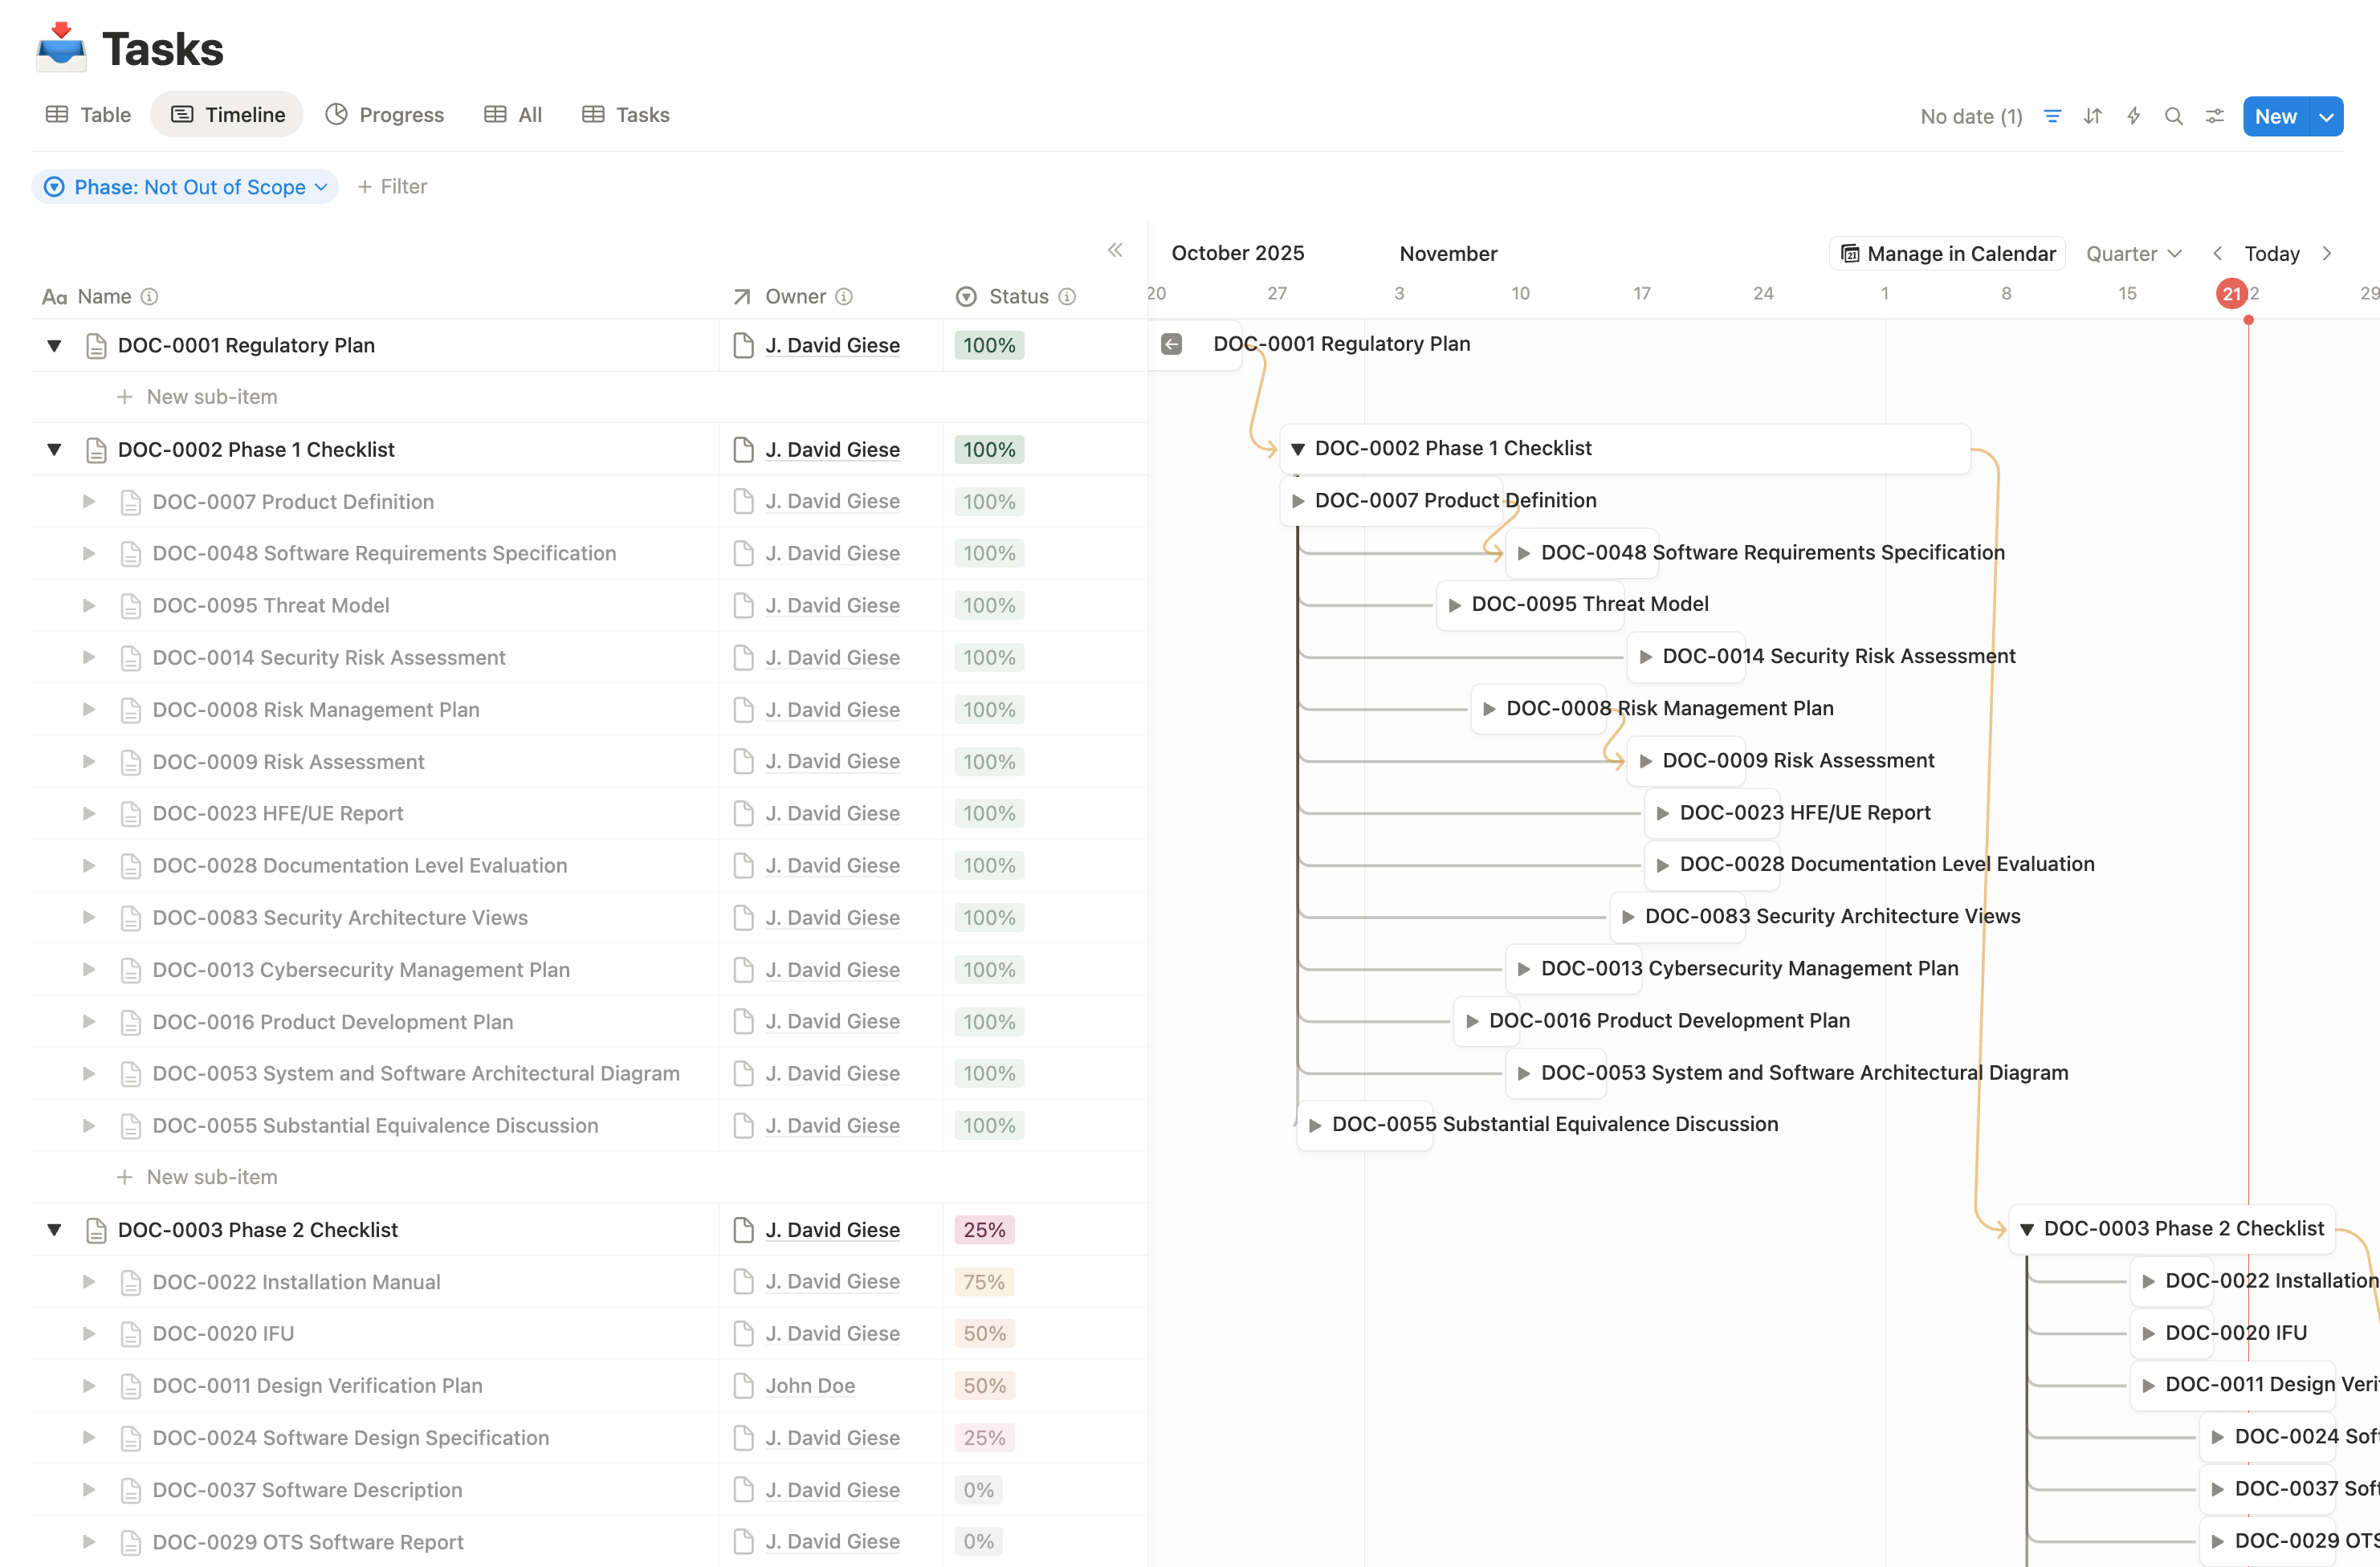
The screenshot below shows an example Gantt chart for one of our Fast 510(k) projects.
Creating the initial Gantt chart 🔗
Once you’ve identified the right tool, the project manager should draft the first version of the chart, then validate it with the team.
Step 1: Identify the scope 🔗
Start by identifying the goal your chart is intended to drive toward. For many of our startup clients, we restrict the scope to the first FDA clearance. As we approach the clearance, we will broaden the scope to include the first commercial scale. If you’re new to the process, consider starting with a smaller goal.
Step 2: List the deliverables that must exist to reach the goal 🔗
- Prefer deliverables and outcomes (e.g., “Cybersecurity documentation complete”) over vague activity (e.g., “Work on cybersecurity”).
- If the goal is FDA clearance, the easiest “checklist” is often the eSTAR deliverables.
- Do not bother including work that is already complete.
- It is much more difficult for a project manager to complete this step without some regulatory and engineering background.
Step 3: Break deliverables into tasks until the task is estimable 🔗
Keep splitting a task until the task owner can answer, with reasonable confidence:
- How long will this take?
- What is left to do?
- What inputs do you need before you can start?
When to stop splitting:
- One person can complete the remaining work.
- That person can give a reasonable time estimate.
When to split further:
- The owner says “I’m not sure how long this will take.”
- Different people will do different parts.
- The work depends on specific inputs that are not yet available.
Step 4: Assign one accountable owner per task 🔗
Each task should have exactly one person who is responsible for driving it to completion.
Other people can contribute, complete sub-tasks, review, or approve, but there should be one clear owner.
Step 5: Add dates and a rough status 🔗
Guidelines:
- In-progress tasks can start at today.
- If a task cannot be estimated until an upstream input exists, still add a best-available estimate, and plan to refine it once the input arrives.
- If percent-complete is hard to estimate, that is often a sign the task is still too large and should be split.
- The status should distinguish between “ready for review” and truly completed, reviewed, and approved
Step 6: Add dependencies (sparingly) 🔗
Add dependencies for tasks that truly cannot begin until another task is complete.
Avoid adding dependencies for “nice to have” sequencing. Adding too many dependencies makes the chart less readable and maintainable.
Step 7: Review with each task owner 🔗
Meet with each person who’s a task owner and step through their tasks, confirming the following for each:
- Ownership is correct
- They agree with time estimates. If they can’t provide an estimate, dig into why.
- If the task is too big, break it into smaller tasks.
- If they require inputs to make the estimate, be sure to add the dependencies.
- All critical upstream dependencies are tracked.
Also confirm that there aren’t any tasks that are missing from the chart.
Maintaining the Gantt chart 🔗
A Gantt chart only works if it is maintained.
It is therefore critical to run a periodic (e.g., weekly or biweekly) meeting where:
- The project manager walks through upcoming tasks that are approaching their completion date.
- Each task owner then updates:
- Completion dates
- Status / percent complete
- Blockers and missing inputs
- The team adds or refines tasks when reality changes.
You do not need to review every task every week.
These weekly meetings, along with each task having a single owner, will force uncertainty up to the surface for discussion. Once the timeline uncertainty is identified, it then becomes possible to optimize the timeline by adding more resources, reducing scope, or pushing some work off until after the first regulatory submission.
Why this approach works 🔗
What the chart is (and is not) 🔗
A Gantt chart is a model—it is an approximation of reality meant for some purpose. For most teams, the primary purpose is to:
- Make the remaining work visible
- Forecast completion dates
- Allocate people to meet deadlines
Because of that purpose:
- You generally do not need to include completed tasks, unless you are explicitly using the chart for retrospective analysis, cost modeling, or process improvement.
- You don’t need to go overboard splitting up very small tasks.
Why “one owner per task” matters 🔗
When one person is accountable for each task:
- There is always someone responsible for identifying what is missing.
- Schedule risk becomes visible earlier.
- It becomes clear who needs help when dates slip.
Without this ownership, it is much easier to blame others.
Why periodic meetings are critical 🔗
Without regular synchronization, the Gantt chart quickly becomes stale and loses its value as a forecasting tool. Weekly or biweekly meetings force task owners to confront reality: are we on track, or do we need to adjust? This cadence also creates a forcing function for the team to communicate blockers early, when they can still be resolved without derailing the timeline.
Why the “keep splitting until it’s estimable” rule works 🔗
When a task owner cannot estimate duration, it usually means one of these is true:
- The task is hiding multiple different activities.
- The task depends on upstream inputs that are not defined.
- Multiple people need to coordinate, but coordination work is not represented.
Splitting forces the team to surface:
- The concrete steps remaining
- The required inputs
- The true coordination points
That is how the chart stops being a vague aspiration and becomes a practical tool the team can steer by.