InVivo Analytics
CTO and Co-Founder at InVivo Analytics

InVivo Analytics is a small academic startup that was interested in our software development services because of our expertise in medical imaging. InVivo Analytics is developing hardware and software to enable fully automated analysis of preclinical imaging studies.
They were looking to build a new team for developing their software, since their existing software partner didn’t have medical-imaging expertise and was making slow progress.
We took over their existing product and delivered working software to their company in a shorter timeline than expected.
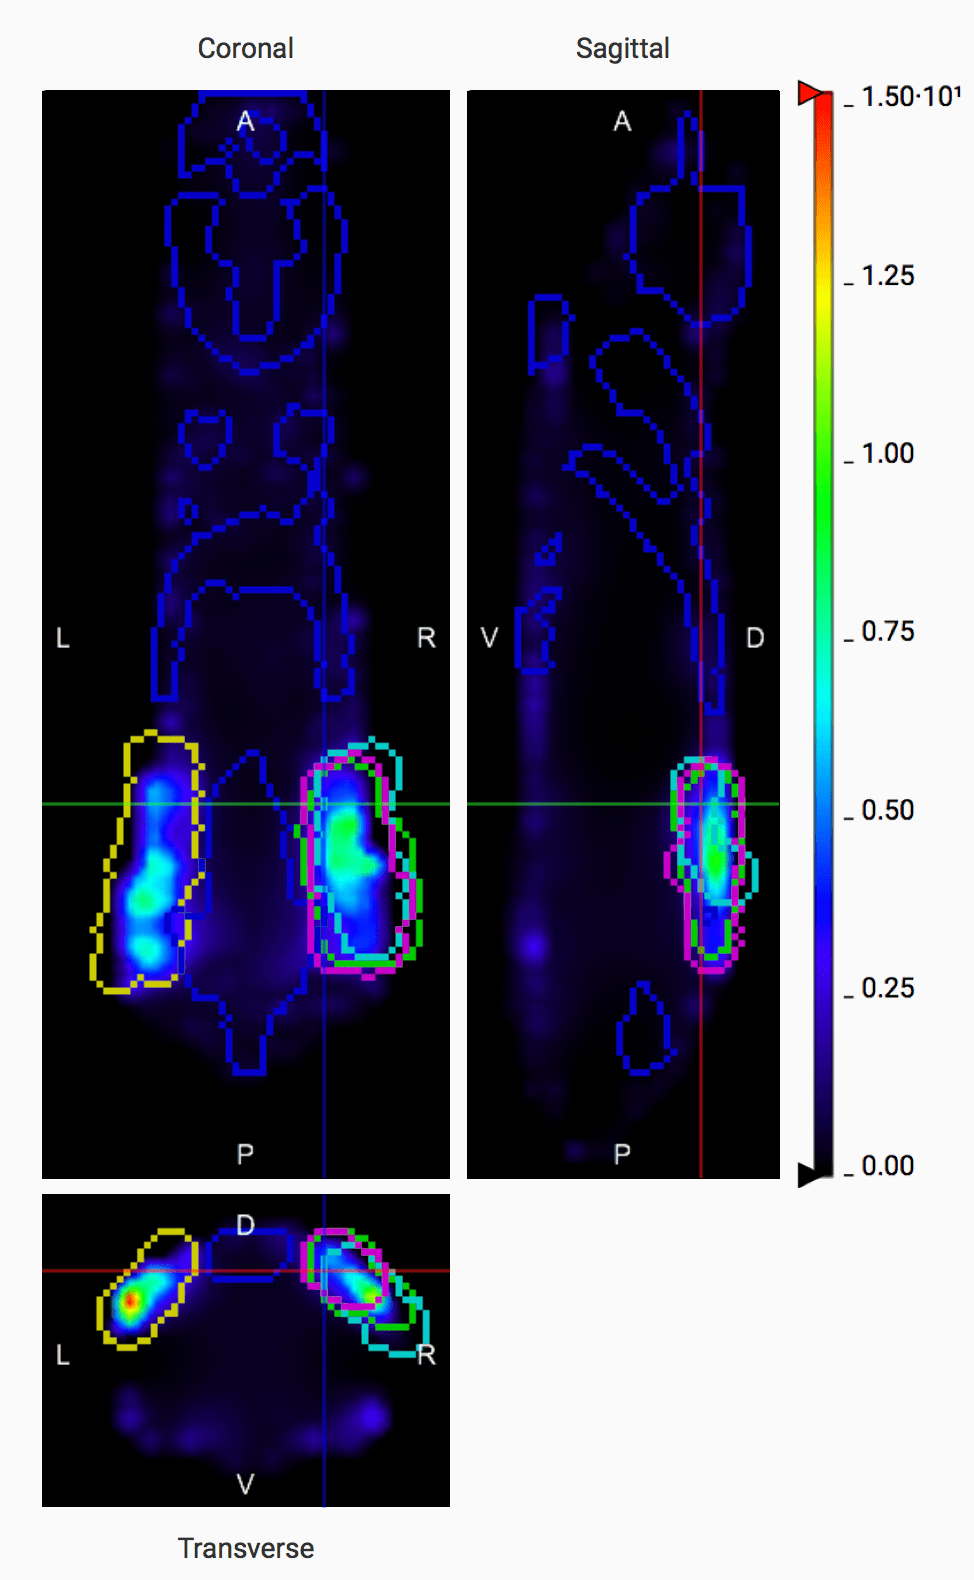
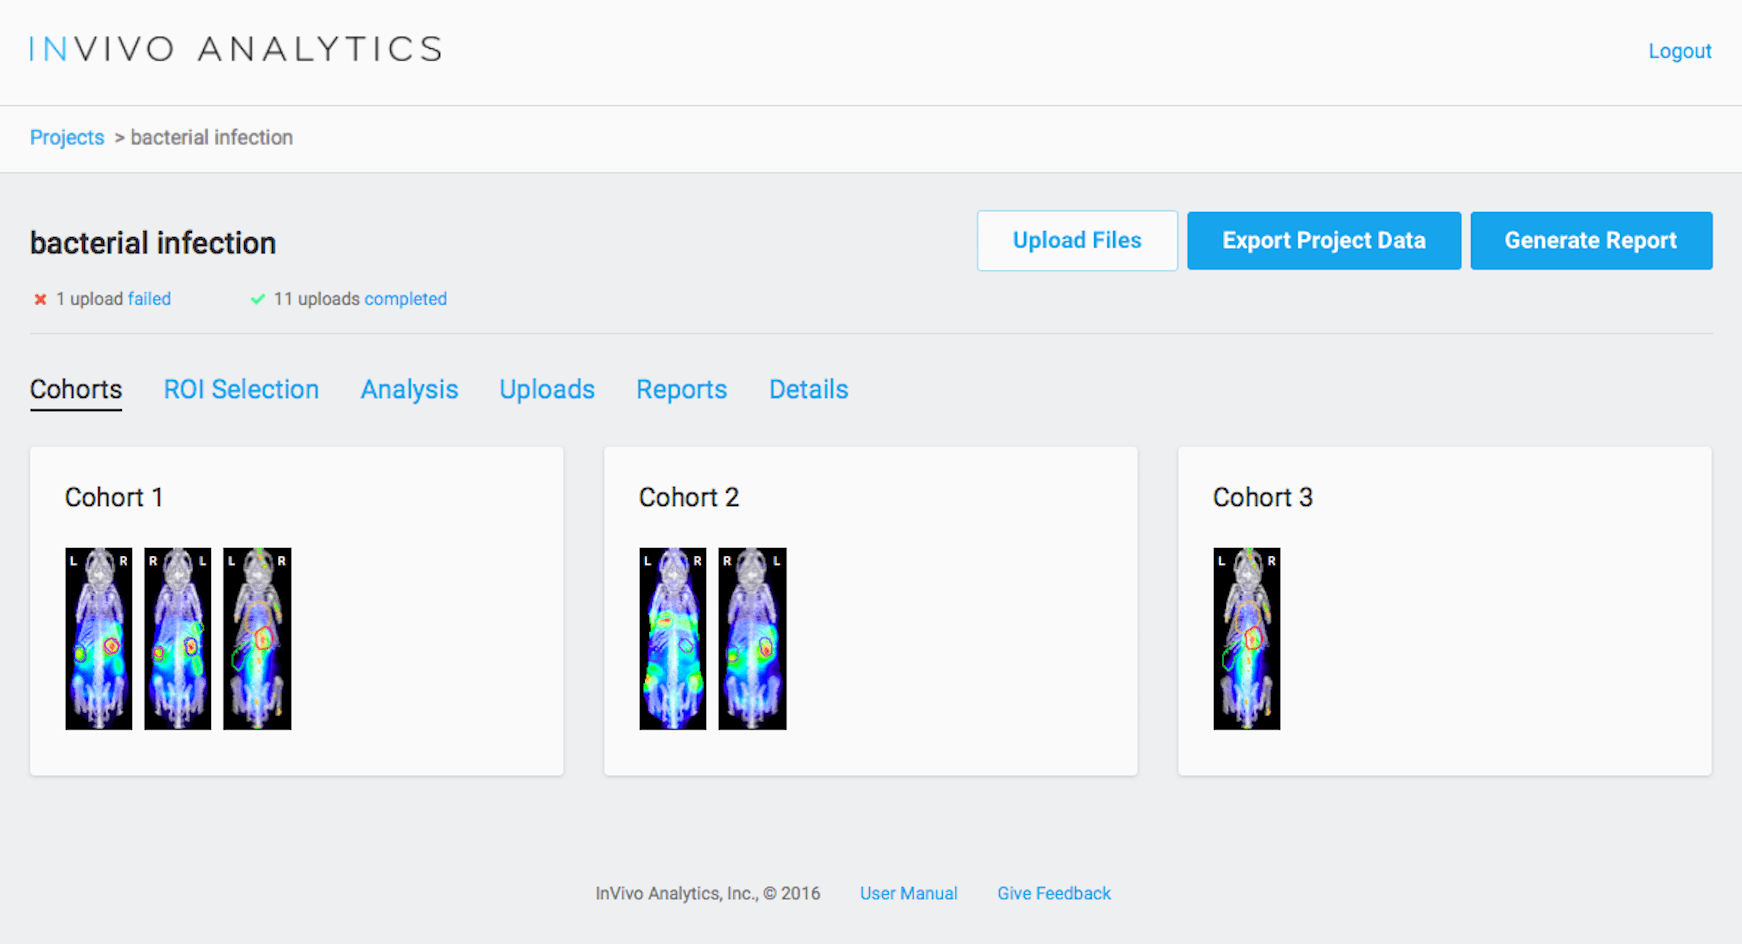
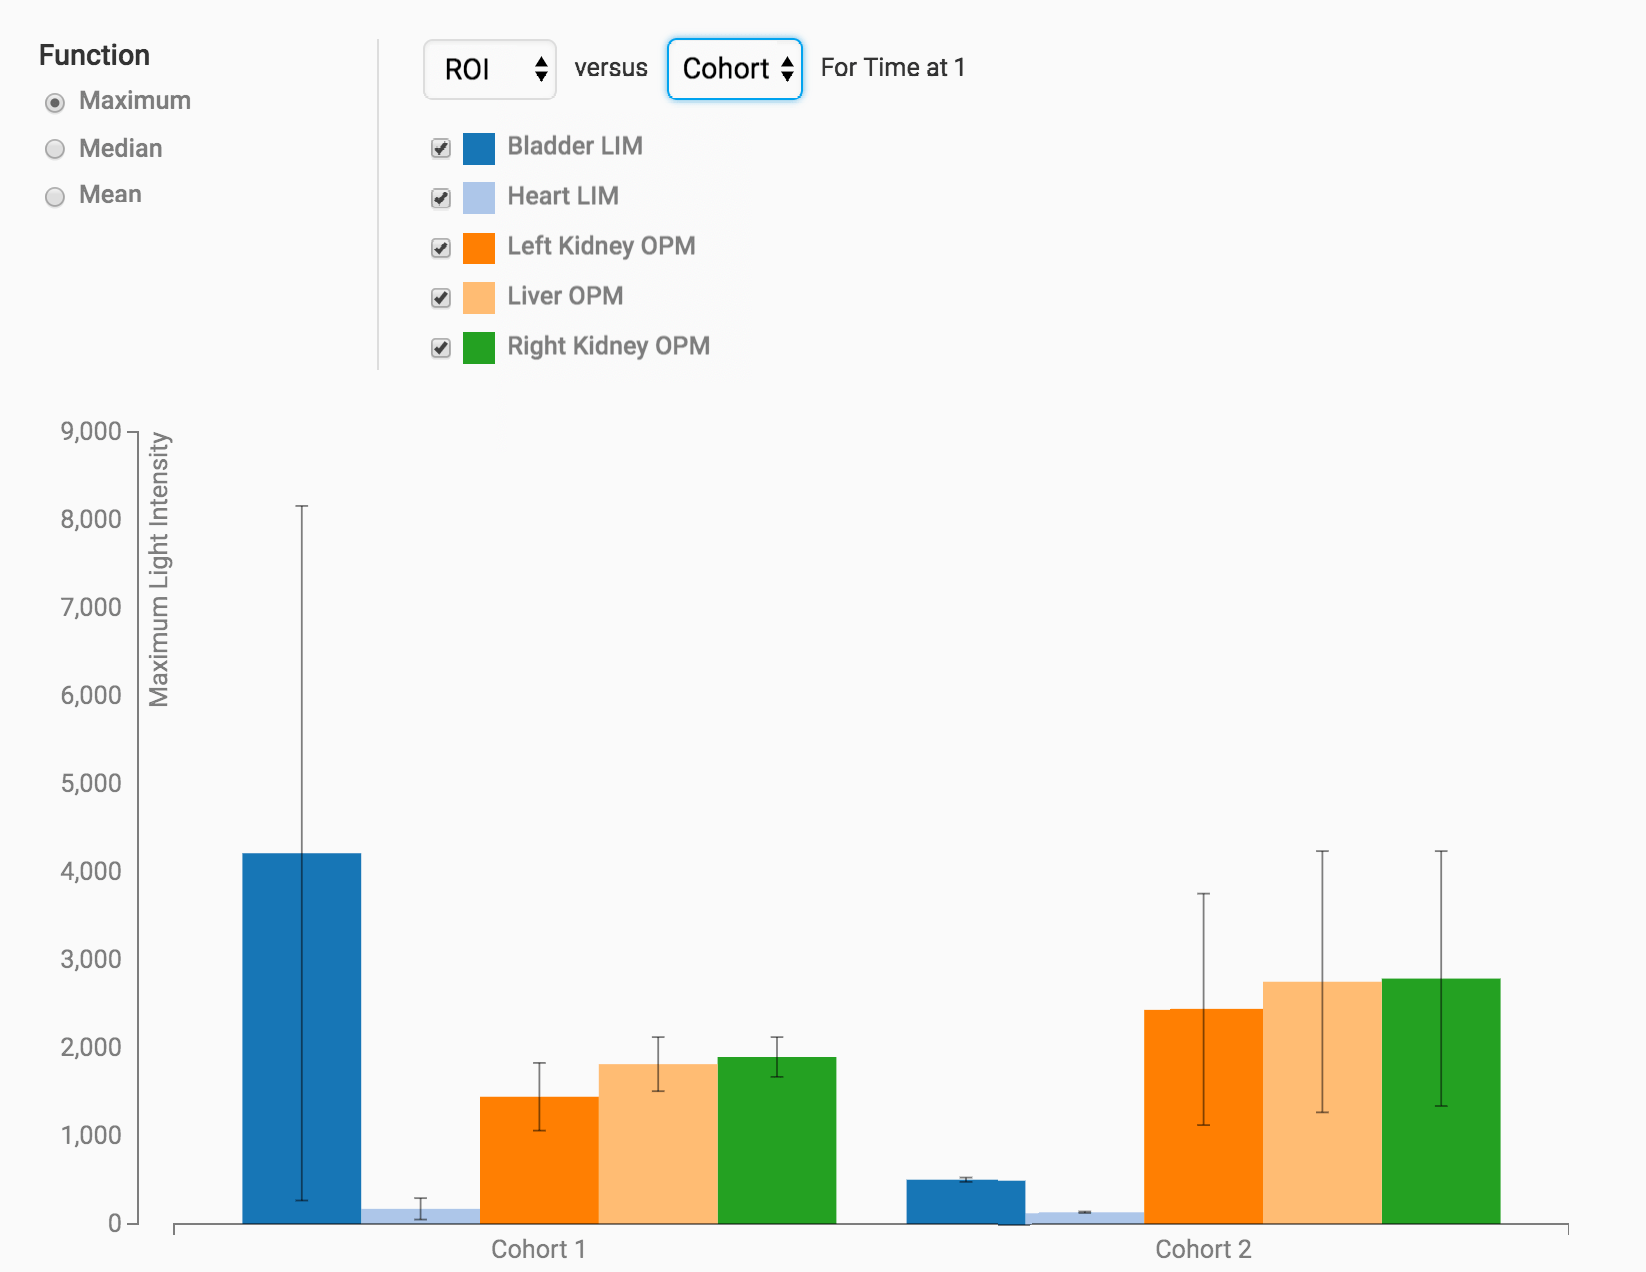
We helped InVivo Analytics extend the existing visualization, data analysis, and 3D image reconstruction features of their web application. We also designed and developed:
The ROI editor and image-viewers used our React medical image user-interface library.

Pre-Clinical
Staff augmentation for highly-technical, PhD heavy engineering team
Pre-Clinical
Over 10x improvement to in-house image-processing GUIs using AI and other optimizations
Every great partnership starts with a conversation. Fill out the form below for a discovery call, and an Innolitics team member will contact you soon.
I learned more from an hour-long Innolitics sales call than an entire paid engagement from other consultants.

Richard Clark
Executive in Residence at Washington University