
Introduction 🔗
Your segmentation model has a good Dice score and an average HD95 of 1.8 mm. Your team can afford to annotate 250 patients. Is that enough to support an FDA submission?
Before we can answer that, we need to decide how much boundary error the clinical task can tolerate. We also need to define what the validation study must show to demonstrate that the device meets that limit.
This guide will show you how to turn the 95th percentile Hausdorff distance, or HD95, into a defined acceptance rule and calculate the sample size for a planned chance of passing. We will work through one example, use an interactive calculator, and work backward from a budget of 250 patients. Python code and lookup tables let you reproduce the results.
FDA's final quantitative imaging guidance recommends setting acceptance criteria from the intended use, defining the experimental unit, and planning the statistical analysis before collecting validation data. It does not prescribe a universal HD95 cutoff or sample size. The numbers below are planning examples, not FDA requirements.

What does HD95 measure in medical image segmentation? 🔗
HD95 measures how much a predicted segmentation disagrees with a reference segmentation along a boundary. Lower values indicate better agreement under the selected implementation.
For the convention used in our example, we find the closest reference boundary point for each predicted boundary point and repeat the process in the opposite direction. We then find the 95th percentile in each direction and report the larger of the two values.
\[HD95=\max\left(Q_{0.95}(d_{P\rightarrow R}), Q_{0.95}(d_{R\rightarrow P})\right).\]Here, \(P\) is the predicted boundary and \(R\) is the reference boundary. Distances are in millimeters when the coordinates or voxel spacing are in millimeters.
This definition is part of the endpoint. Some implementations aggregate both sets of distances. Others use different surface extraction or weighting methods. The HDilemma study noted significant differences among implementations. Note the software version, 2D or 3D calculation, surface definition, weighting, percentile method, and directional combination. Ensure both masks use the same physical coordinate system and spacing is aligned with the array axes. An average of slice-level HD95 values is not the same as 3D HD95.
HD95 is also not the maximum boundary error. A small extra region can have a large error without changing the 95th percentile.

Keep these three uses of 95 separate.
| Quantity | What it describes |
|---|---|
| HD95 | The 95th percentile of boundary distances within one segmentation comparison, under the specified convention |
| 95% patient pass rate | The proportion of patients whose results satisfy a defined case rule |
| 95% confidence bound | Statistical uncertainty about a population quantity estimated from the study |
Step 1. Set the clinical limit before choosing the sample size 🔗
Start with what the segmentation will be used for. A contour used for volume measurement and a contour used near a critical treatment boundary may need different limits and supporting endpoints.
Build the rationale based on the task to be performed, the impact of an error, associated literature, or similar devices, and reference annotation that aligns with your task. While expert disagreement is helpful, it is not sufficient to establish that the same error would be clinically reasonable.
On separate development data, compare candidate HD95 limits with blinded expert judgments of contour acceptability and downstream task errors, where relevant. Review serious errors that occur even below a candidate limit. Document why the selected distance limit and allowed patient failure rate fit the clinical risk. The 95% pass rate floor used below also needs that justification.
| Intended use | Evidence to consider alongside HD95 |
|---|---|
| Measure an organ or lesion volume | Volume error and agreement across the claimed size range |
| Support treatment contouring | Expert acceptability and downstream effects relevant to treatment |
| Segment lesions that may be missed or falsely added | Lesion sensitivity, false positives, and rules for matching lesions |
Public 510(k) summaries illustrate why the endpoint needs this context. ART-Plan K234068, PDF pages 8 and 9, describes a mean HD95 criterion of 5.75 mm or less, with other quantitative and expert assessments. Neosoma Brain Mets K252922, PDF pages 12 and 13, evaluates HD95 on true positive lesions and reports sensitivity and false positives separately. Neither example establishes a cutoff for another device.
For our example, suppose the team has justified 3.0 mm for one named organ in a defined CT population. This value is hypothetical. We choose it to demonstrate the method. We do not derive it from the pilot model's average error.
If the clinical limit or endpoint remains uncertain, consider a Pre-Submission with a proposed protocol, rationale, and focused questions before spending the validation budget.
Step 2. Write a patient rule and a study rule 🔗
In this example, each individual patient provides one predefined CT volume. The reference organ is present, and qualified readers define its contour under a written annotation and adjudication procedure.
A patient passes this endpoint when the device produces the required segmentation and its HD95 is at most 3.0 mm. An empty prediction or a failed device run counts as a failure. We do not discard it because the metric returned NaN or infinity.
The study passes this endpoint when the one-sided 95% exact lower confidence bound for the patient pass rate is greater than 95%. We use the Clopper-Pearson bound.
Let \(p\) be the true population pass rate for this case rule. The study criterion is:
\[L_{95\%}(p)>0.95.\]This asks whether more than 95% of the intended population meets the case rule, with the stated confidence procedure. A confidence bound for mean HD95 answers a different question. A low mean can coexist with some poor cases.
Our pass rate method is designed to answer the question stated above. It should not be used to replace a pre-specified mean HD95 endpoint. If the claim calls for a mean, percentile, or paired comparison, plan power for that estimator and its confidence interval instead.
Define other outcomes before testing. If both masks are empty due to a lack of anatomy, HD95 has no boundary with which to compare. Address these situations under a separate absence rule if they are in scope. Missing reference data require prespecified accounting and exclusion rules. Keep them distinct from device failures.
For multiple required organs, one possible patient rule requires every organ to pass its own limit. Then the planning input must be the joint patient pass rate. Do not consider organs, slices, phases, or boundary points as independent patients. If the analysis retains those repeated measurements, use a design and analysis that accounts for their dependence.
Step 3. State the planning assumptions 🔗
Estimate the expected patient pass rate from case level pilot outcomes. The average HD95 of 1.8 mm in our introduction cannot supply this rate. Use pilot data that were not used to select the final model or acceptance threshold. Count failed outputs using the same rules planned for validation. Run several plausible scenarios because a small pilot can make performance look better than it is.
Here are the assumptions we will use in our example:
| Input | Example |
|---|---|
| Case threshold | HD95 at most 3.0 mm, with required output produced |
| Minimum population pass rate, \(p_0\) | 95% |
| Expected true pass rate, \(p_1\) | 98% |
| Confidence rule | One-sided 95% exact lower bound strictly above \(p_0\) |
| Target power | 90% |
| Sampling model | Independent patients sampled from the intended population, with a common marginal pass probability |
We choose a one-sided bound because the question is whether the pass rate clears a floor. This is an example design choice. The lower end of a two-sided 95% interval uses a different tail probability and needs a new calculation. The code uses alpha=0.05 for the one-sided rule. Use alpha=0.025 for that two-sided lower endpoint.
For this binary endpoint, an exact binomial calculation avoids having to assume a normal or lognormal distribution for HD95. The distance threshold still matters. Changing 3.0 mm changes which patients pass and therefore changes the expected pass rate.
Interactive HD95 sample size calculator 🔗
You can use the calculator to plan a sample size or see what your current budget can support. Try our example first, then enter an expected pass rate supported by your pilot data.
Interactive planning tool
HD95 sample-size calculator 🔗
Start with a patient pass rule that you have justified clinically. For example, a patient passes if HD95 is at or below a specified distance. The article uses a hypothetical 3 mm limit. A distance alone cannot set the sample size.
Minimum qualifying sample size
Required patient passes
Your patient budget 🔗
Power at each patient count
The jumps are real. Allowable failures change in whole numbers, so a larger sample can have lower power. Check the exact count you plan to use.
Uses an exact Clopper-Pearson lower bound for one prespecified patient pass rule, with independent patients and a common pass probability. These are evaluable patient counts. Repeated scans, missing data, subgroup targets and multiple endpoints need a design-specific plan. A calculated sample size does not establish an FDA acceptance criterion.
The default result is 311 patients for at least 90% power. A budget of 250 patients gives about 76.4% power under the same assumptions. Try changing the expected pass rate from 98% to 97%. The required sample size increases to 832 patients.
The calculator uses the same exact binomial rule as the Python example. An HD95 limit alone cannot supply the expected pass rate. If you change the clinical limit, estimate that rate again from individual pilot outcomes. The power curve shows why you should check the exact patient count you plan to use, even when you round a sample size result upward.
Step 4. Calculate sample size and check it by simulation 🔗
For each proposed sample size \(N\), find the smallest number of passing patients \(k\) that clears the confidence rule. Then calculate the probability of getting at least \(k\) passes if the true pass rate is \(p_1\).
\[X\sim\operatorname{Binomial}(N,p_1), \qquad \text{power}=P(X\ge k).\]We use SciPy's binomial distribution and exact Clopper-Pearson interval.
The example was tested with Python 3.9.6, NumPy 2.0.2, and SciPy 1.13.1.
from scipy.stats import beta, binom


def lower_bound(k, n, alpha=0.05):
    """One-sided exact lower confidence bound at confidence 1 - alpha."""
    if n < 1 or int(n) != n or int(k) != k or not 0 <= k <= n:
        raise ValueError("Require integer counts with 0 <= k <= n and n >= 1")
    if not 0 < alpha < 1:
        raise ValueError("Require 0 < alpha < 1")
    return 0.0 if k == 0 else float(beta.ppf(alpha, k, n - k + 1))


def required_passes(n, p0, alpha=0.05):
    """Return n + 1 if the study cannot pass, even with zero failures."""
    lower_bound(0, n, alpha)
    if not 0 < p0 < 1:
        raise ValueError("Require 0 < p0 < 1")
    k = int(binom.isf(alpha, n, p0)) + 1
    # Check the strict confidence-bound rule at the discrete boundary.
    while k <= n and lower_bound(k, n, alpha) <= p0:
        k += 1
    while k > 1 and lower_bound(k - 1, n, alpha) > p0:
        k -= 1
    return k


def plan(p0, p1, target_power=0.90, alpha=0.05, n_max=10_000):
    """Find the smallest fixed n whose exact power meets the target."""
    if not 0 < p0 < p1 <= 1 or not 0 < target_power < 1:
        raise ValueError("Require 0 < p0 < p1 <= 1 and 0 < target_power < 1")
    if not isinstance(n_max, int) or n_max < 1:
        raise ValueError("n_max must be a positive integer")
    for n in range(1, n_max + 1):
        k = required_passes(n, p0, alpha)
        power = float(binom.sf(k - 1, n, p1))
        if power >= target_power:
            return n, k, power
    raise ValueError("No qualifying sample size found through n_max")

import numpy as np

n, k, power = plan(p0=0.95, p1=0.98)
rng = np.random.default_rng(20260907)
trials = rng.binomial(n, 0.98, size=100_000)
simulated_power = np.mean(trials >= k)

print(f"Patients: {n}, required passes: {k}")
print(f"Exact power: {power:.4%}")
print(f"Simulated power: {simulated_power:.4%}")
print(f"Lower bound at {k} passes: {lower_bound(k, n):.6%}")
Output:
Patients: 311, required passes: 302
Exact power: 90.2247%
Simulated power: 90.2270%
Lower bound at 302 passes: 95.004496%
For the worked scenario, the smallest sample size reaching 90% power is 311 independent patients. It requires at least 302 passes, allowing at most 9 failures. Exact power is 90.22%. At 302 passes, the one-sided lower bound is approximately 95.0045%, just above the 95% floor.

The simulation checks the probability of passing the same rule. It does not validate the clinical threshold or prove that the assumed 98% rate is realistic.
Results and takeaways 🔗
The table below keeps the minimum population pass rate at 95% and the confidence rule unchanged. We check sample sizes in order and stop at the first that reaches the target, with a search limit of 10,000.
| Expected true patient pass rate | Patients for at least 80% power | Patients for at least 90% power |
|---|---|---|
| 96% | 2,698 | 3,701 |
| 97% | 601 | 832 |
| 98% | 234 | 311 |
| 99% | 124 | 153 |
The gap between expected performance and the acceptance floor drives the cost. If the true pass rate is only 96%, a study designed to clear 95% needs thousands of patients. At a true rate of 95% or below, this test's chance of passing is at most 5%. Increasing the sample size cannot turn that into 80% or 90% power.

Recalculate power at the exact sample size you plan to use. The required pass count changes in whole patients, so exact power has small rises and drops. In this example, a study of 234 patients reaches 80% power, but rounding up to 250 gives only 76.4%. The table does not promise that every larger sample size meets the same power target.
What if the budget is 250 patients? 🔗
At \(N=250\), the study needs at least 244 passes, so it can tolerate 6 failures. Under the expected 98% true pass rate, the chance of achieving this is 76.4%.
We can also work backward. What true patient pass rate would give us the target power with this budget?
| Target power with 250 patients | Required true patient pass rate, approximately |
|---|---|
| 80% | 98.102% |
| 90% | 98.435% |
With 250 patients, 90% power requires a true patient pass rate of about 98.435% under this study rule. Use independent pilot data to assess whether that assumption is plausible, and check lower rates because pilot estimates are uncertain. This is not a required observed pilot score or a rule for finalizing the model. At an assumed 98% pass rate, plan 311 evaluable patients for 90% power. If your budget remains 250, assess whether better model performance is realistic or revisit the intended claim with a clinical rationale. Keep the validation population representative. Do not relax the HD95 limit just to fit the budget.
For 311 analyzable patients and 10% expected loss from unusable reference data, \(\lceil311/0.90\rceil=346\) is an expected yield collection estimate. It does not guarantee 311 usable references. Plan how to fill the prespecified analysis set without looking at pass results. Device failures remain in that set. Do not keep adding patients until the confidence bound passes.
What belongs in the validation protocol? 🔗
Before testing, connect the intended use to the clinical limit, reference standard, exact metric implementation, case rule, confidence method, and sample size assumptions. Freeze the device version, preprocessing, and any postprocessing. State whether the endpoint measures the raw device output or a contour corrected by a clinician. Evaluating corrected contours alone does not establish the accuracy of the raw device output.
Set the dataset composition to reflect the intended population, scanners, acquisition settings, anatomy, and relevant difficult cases. FDA's Good Machine Learning Practice page points to principles covering representative data, independent training and testing, suitable reference standards, and clinically meaningful goals.
The overall sample size does not guarantee enough patients in each subgroup. Fixed site quotas, repeated measurements, or separate claims for multiple structures may need another analysis. If several primary endpoints must all pass, plan their joint success probability. The 90% power above covers only the stated patient pass rate endpoint.
HD95 and clinically significant failures should be reported along with the pass rate. Report individual HD95 values alongside the pass rate to show how far failed cases exceed the limit and whether failures cluster by anatomy or acquisition setting.
Frequently asked questions 🔗
Is HD95 below 5 mm acceptable to FDA? 🔗
There is no universal 5 mm rule in the FDA guidance discussed here. The answer may depend on the anatomy, the design purpose, the clinical effects, the reference standard, and the endpoint. A cutoff in another device's summary is supporting context, not automatic justification.
Is Dice sufficient if it is already high? 🔗
Dice measures overlap. HD95 adds boundary information. Figure 2 shows that even high Dice and low HD95 can coexist with an extra region. Choose additional checks for the failures that affect the clinical task.
Can 59 patient with no failures set a 95% pass rate floor? 🔗
For this one-sided 95% exact rule, 59 passes out of 59 clears the 95% floor. But if the true pass rate is 98%, the probability of that outcome is only \(0.98^{59}\), about 30.4%. A result that can pass is not the same as a study planned with 90% power.
From an HD95 result to a clearance plan 🔗
Your engineers, clinical reviewers, and regulatory team need a validation plan they can work with. It should explain what counts as a patient pass, why that result is clinically acceptable, and how the study supports the device's claims.
Through our end-to-end FDA clearance service, we help with medical imaging software, reference data, validation, submission preparation, and FDA review. Bring your intended use, pilot results, annotation plan, and available patient count so we can work through a clearance plan with you.
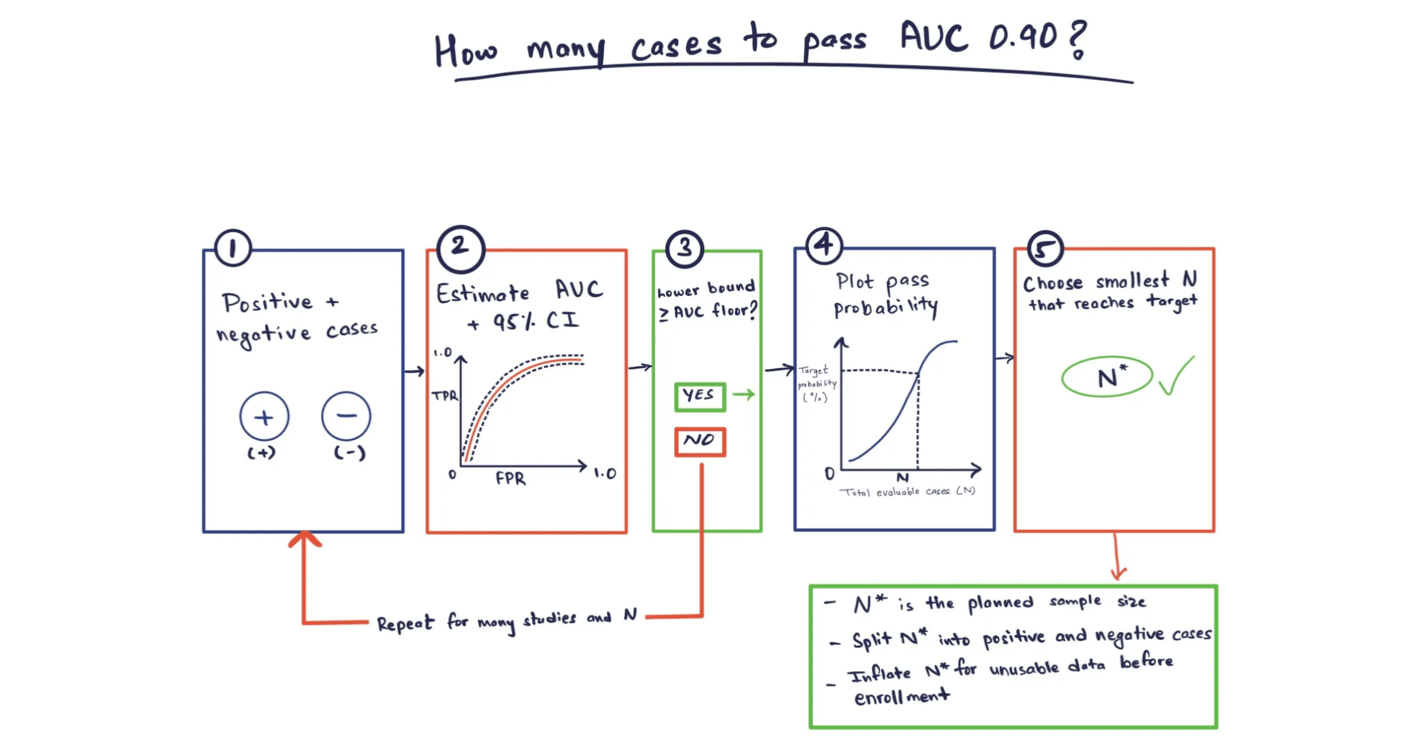
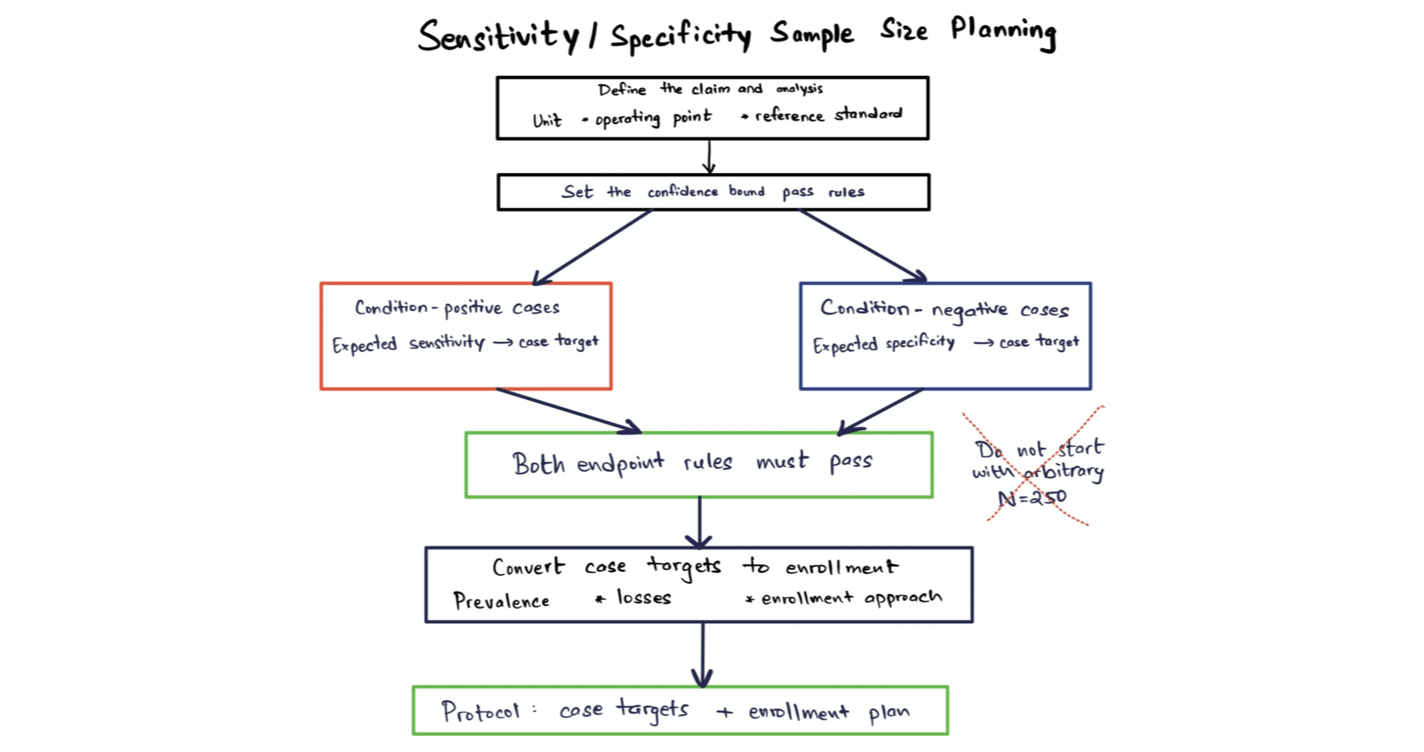
For other endpoints, see our guides to Bland-Altman sample size, AUC study planning, and sensitivity and specificity sample size.
Sources 🔗
- FDA. Technical Performance Assessment of Quantitative Imaging in Radiological Device Premarket Submissions. Final guidance, June 2022, pages 11 to 13. Supports the planning framework, not a numerical HD95 rule.
- Podobnik and Vrtovec. HDilemma: Are Open-Source Hausdorff Distance Implementations Equivalent? MICCAI 2024. Explains implementation differences.
- ART-Plan K234068 510(k) summary. PDF pages 8 and 9. Product-specific mean HD95 criterion and supporting assessments.
- Neosoma Brain Mets K252922 510(k) summary. PDF pages 12 and 13. HD95 for true-positive lesions and separate detection endpoints.
- FDA. Requests for Feedback and Meetings for Medical Device Submissions: The Q-Submission Program. Final guidance, May 2025. Describes voluntary feedback on a concrete proposed study.
- SciPy 1.13.1 binomial distribution and exact proportion confidence intervals. Methods used in the numerical example.